
IBM Long-term outlook
Undervalued, is the rating given to IBM under report made by Morgan Stanley on the free cash flow generated by cloud computing business up to 2025. The reorganization and shift into the cloud computing business proof to be successful for IBM and help the company escape “killed by modern technology.”
The shares continue its increase in February and surpass 2015 high, and it is expected to continue its upward movement in coming months.

Click here to see IBM February analysis
New Month
Monthly chart
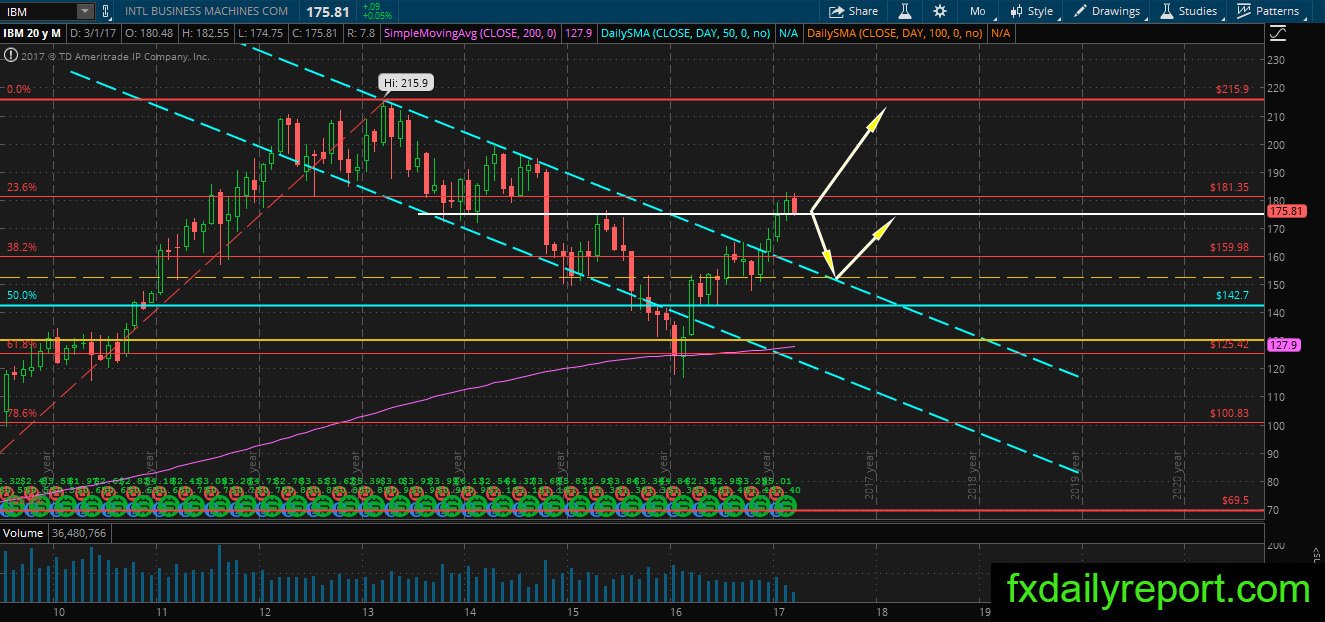
Since the share price hit the target, it moves lower in March. The month has not ended yet, and the price seems to look for an opportunity to reverse the selling at the end of the month. If it decides to continue the retracement, blue channel will be the target. On the upside $181.35 act as resistance.
Weekly chart
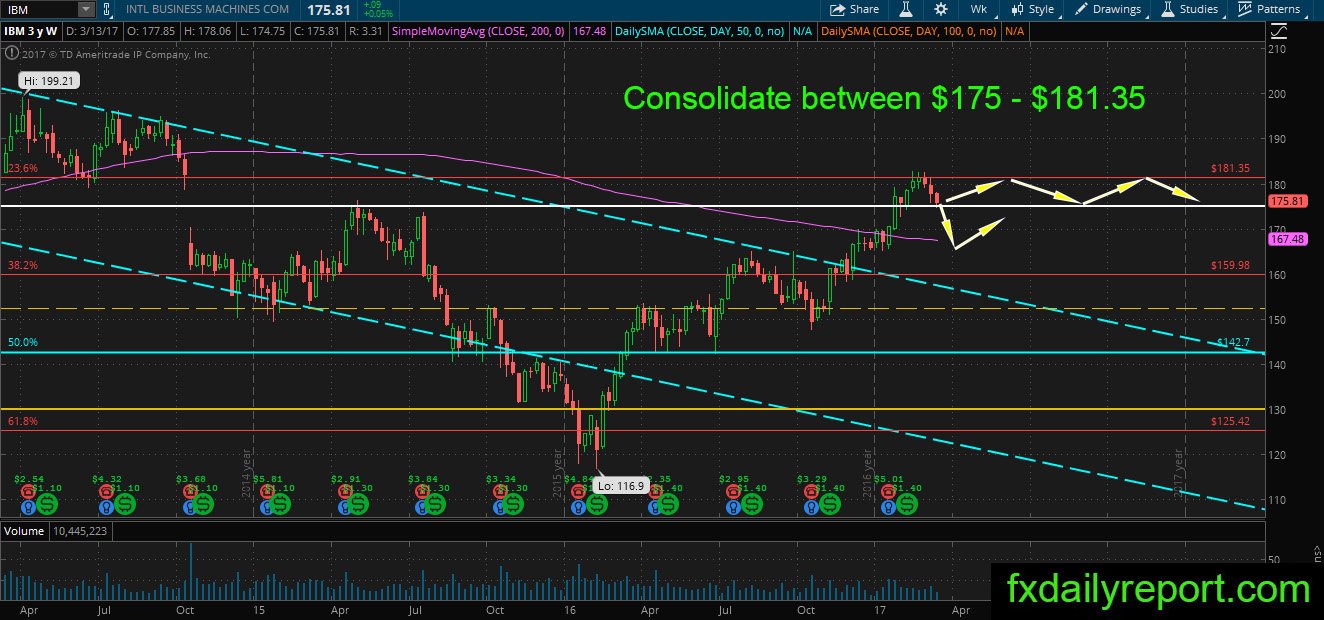
The weekly chart of IBM show possibility of consolidation between $175 – $181.35. If the price manages to close lower than the range, it might find support at WSMA 200.
Daily chart
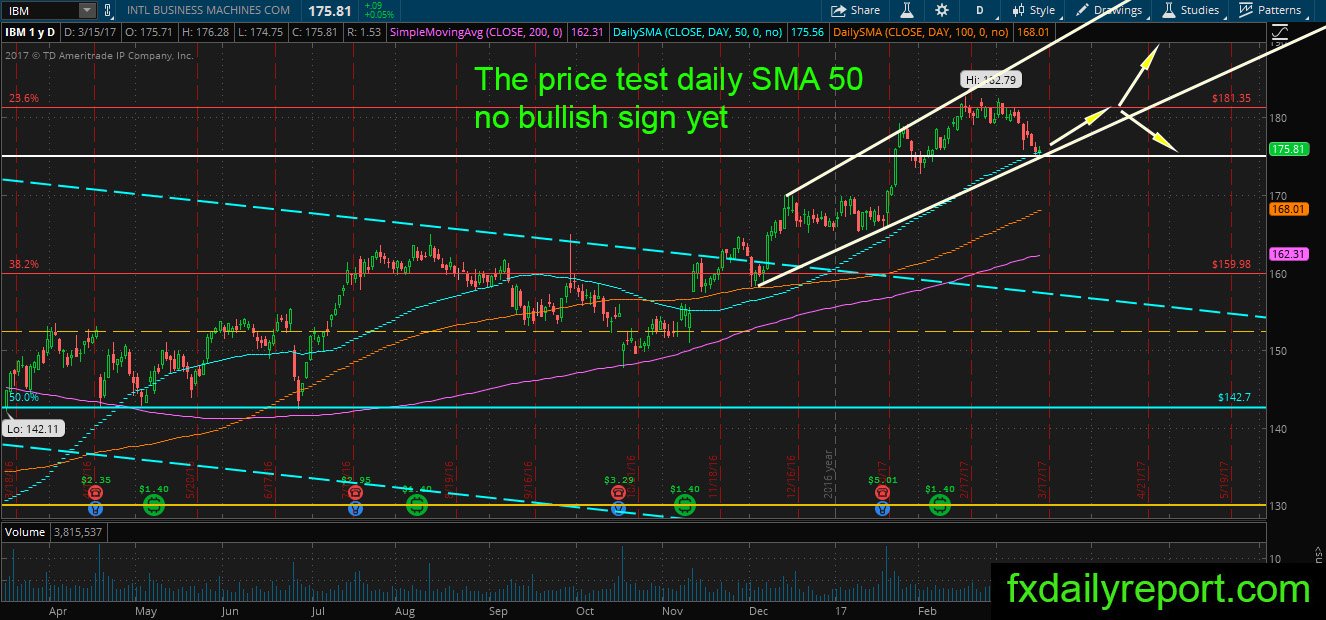
IBM fell to the trendline and also white horizontal support line where daily SMA 50 present. There is no bullish sign yet, but if things are proceeding as expected, the price should bounce higher from the confluence of support.
Trade plan
Bullish position observes how price reacted at the confluence of support level on the daily chart.
The bearish position is best taken near $181.35 resistance using tight stop loss order.