
IBM Long-term outlook
IBM is rated undervalued in the previous analysis, but it seems the company still could not shake problem at hand. Straight 21 quarters decline in revenue is something which drives investors away even though valuation cheap. Good news is the company investing heavily in the newer area which expected to produce growth. Aside from that, IBM also sold its underperforming units to reduce losses.
Though there is nothing to expect in short-term, the company might return its shine once again when the new growth units flourished. Share prices could fall further before IBM could turn the table on revenue and profits.

Click here to see IBM March analysis
New Month
Monthly chart
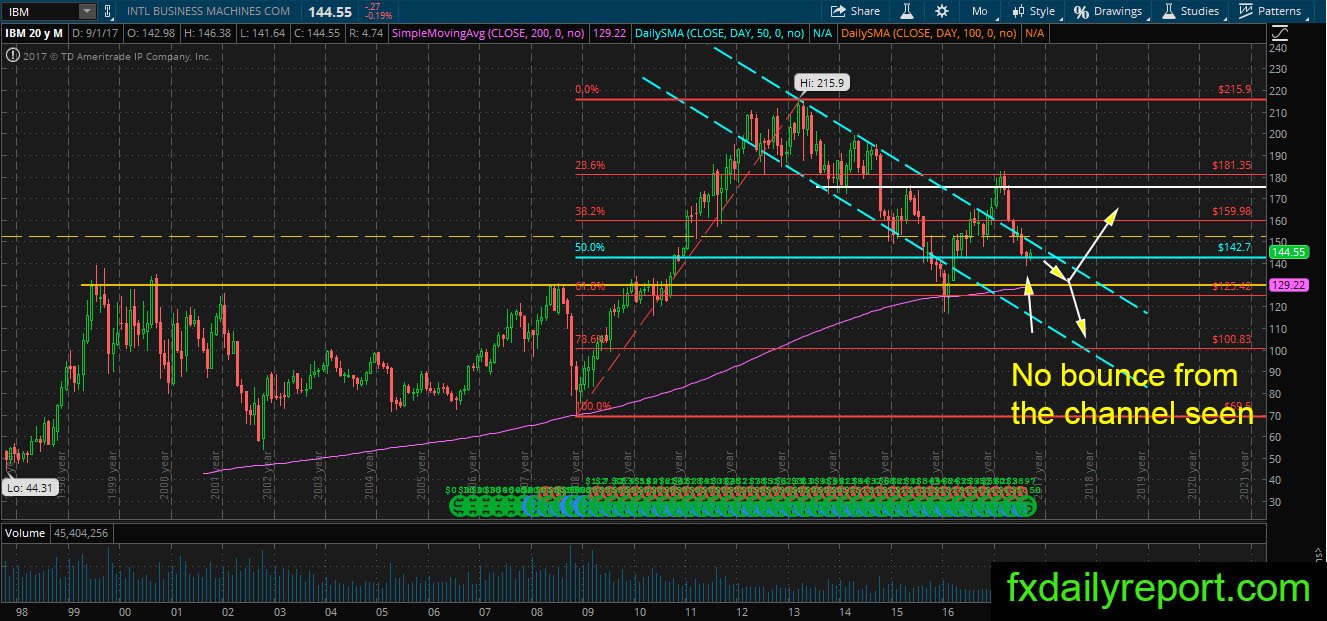
IBM on the monthly chart failed to lift the share prices above its blue channel. The share prices are currently testing 50% Fibonacci retracement level and see a close above it in the previous month. However, overall the share prices need to move above the bearish channel to avoid further sell-off.
Weekly chart
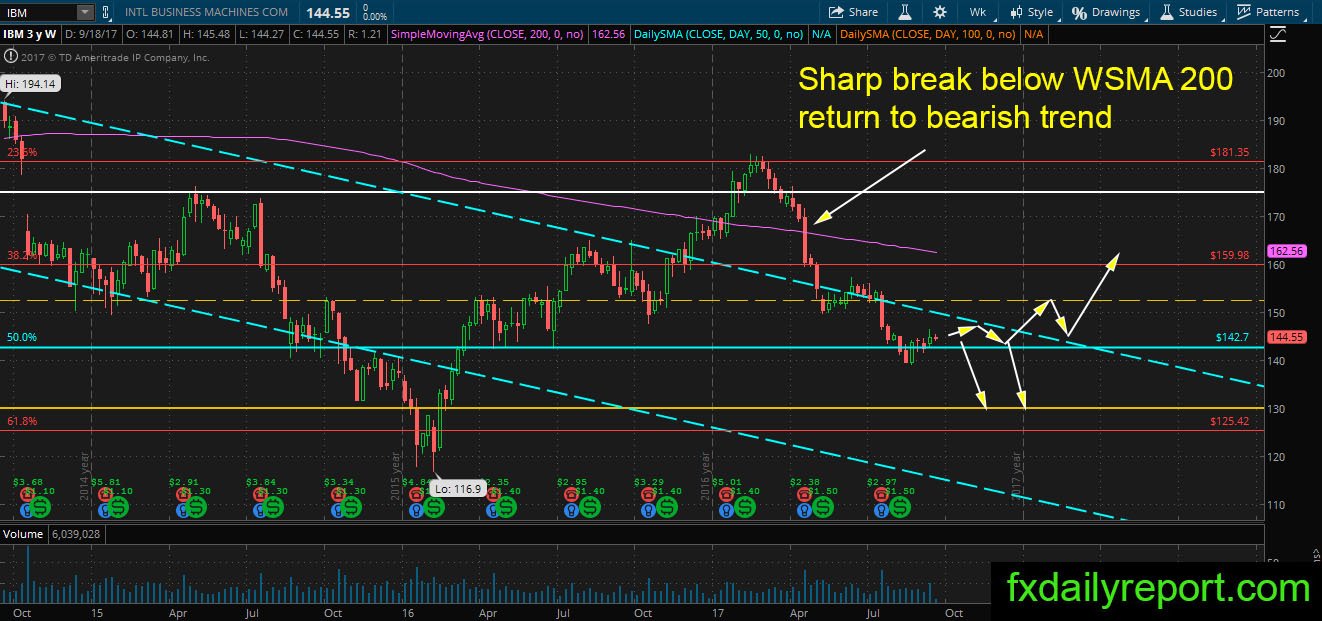
The weekly chart of IBM shows the trend has switched to bearish since the share prices return below weekly SMA 200. The only reason to take a long position is the 50% Fibonacci retracement which has proven itself as a strong support level in the past. Traders might want to stay sideway until the share prices move above the blue channel.
Daily chart

The trend on IBM daily chart is bearish, and it is better to avoid looking for a long position. Currently, the price is testing the daily SMA 50 and stay below it. Bear traders could look for short position near the averages.
Trade plan
Bullish position needs to wait until the share prices claim a level above the blue channel.
The bearish position could be taken near the daily SMA 50.