
KMB Long-term outlook

Kimberley Clark share prices suffered a deep downward pressure in July as share prices down from $129.61 to $123.16 or down 4.9%. The company problem in organic growth continue to persist, and competitive environment hit company profitability. KMB reported dismal earnings per share and revenue in the second quarter and the company offer softer earnings guidance for the full year.

Sluggish second quarter results mostly contributed by rising inflation which leads to higher cost. On the other hand, slower organic growth hit KMB in North America and Latin America.
Overall, traders and investors could see a thin light in company higher cost-saving effort and growth in China. However, the company needs to innovate more on its product line to survive the competitive environment.
Click here to see KMB May 2017 analysis
New Month
Monthly chart

The upward movement of KMB on the monthly chart stay intact. However, the share prices currently hovering near the bottom of the channel. There is no bullish indication yet even though KMB hit the bottom of the channel. Traders might want to observe further the price development before entering a position. If KMB could hold the bearish pressure and reverse it at the bottom of the channel, it will start new leg toward the record high.
(There is possibility of break downside though as the price formed lower high on the monthly chart)
Weekly chart
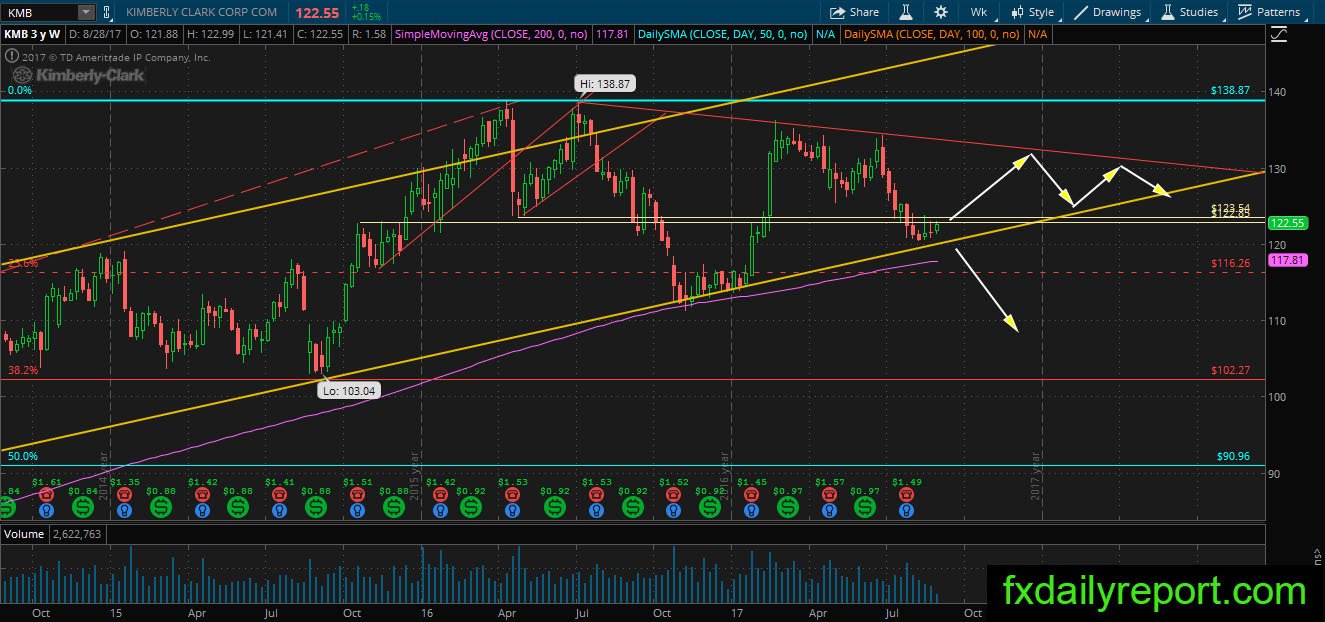
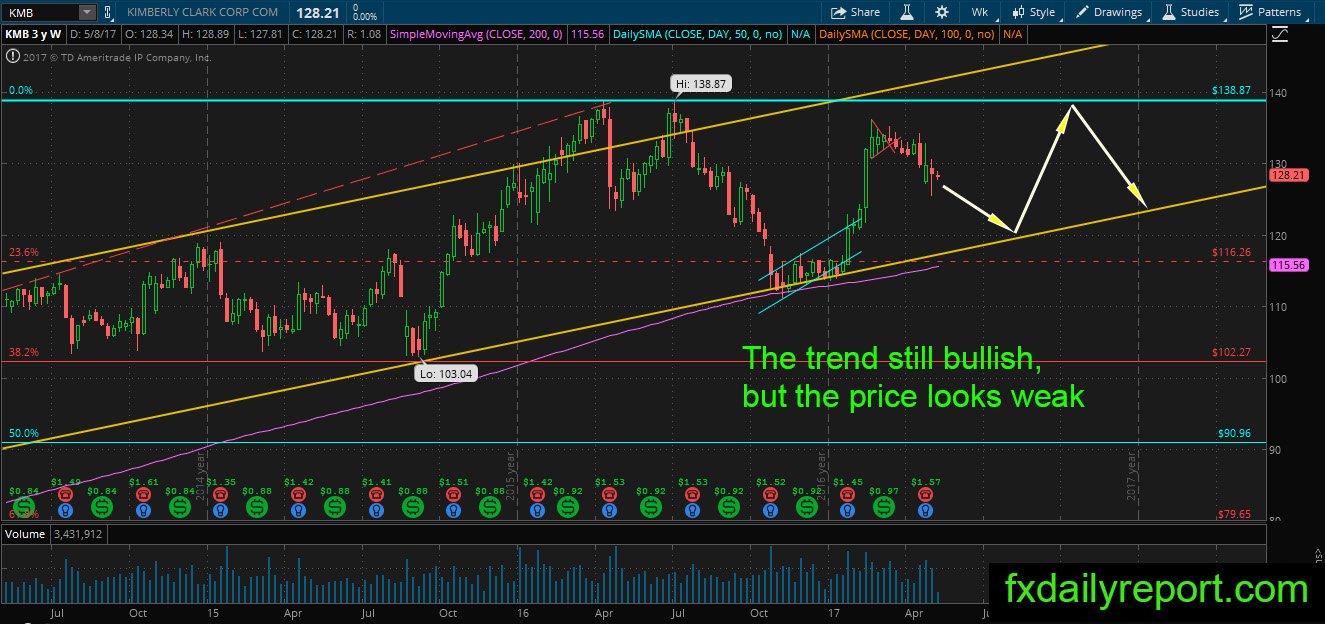
In the previous analysis, we mention about the downward movement of KMB toward the bottom of the channel. The price followed the track downward and currently in a wait and see mode. Will the share prices form bullish pattern near the bottom of the channel and start another bullish leg?
On the upside, the red trend line is the target. On the downside, weekly SMA 200 might become strong support level to hold the price from further downside.
Daily chart

KMB on the daily chart is struggling to reverse the bullish trend. The short-term direction is downward and amplified by the break below daily SMA 200. The situation is developing into a disadvantage for the bull. However, as long as long-term outlook stay bullish, traders could expect reversal is on the way.
Trade plan
Long position needs to wait for a valid bounce from the bottom of the channel. If traders place long position near the channel, they could use Feb’17 low ($120.38) or previous swing low $111.3 as a stop level.
The short position could be taken from the failure of daily SMA 200 re-test.