
Polygon MATIC (soon to be $POL) has recently shown signals for a likely bullish breakout. The latest $MATIC analysis highlights a huge bullish flight of the trading pair “MATIC/USDT” as evidenced by a sheer price rise clearing the chief resistance levels to reach $0.53.
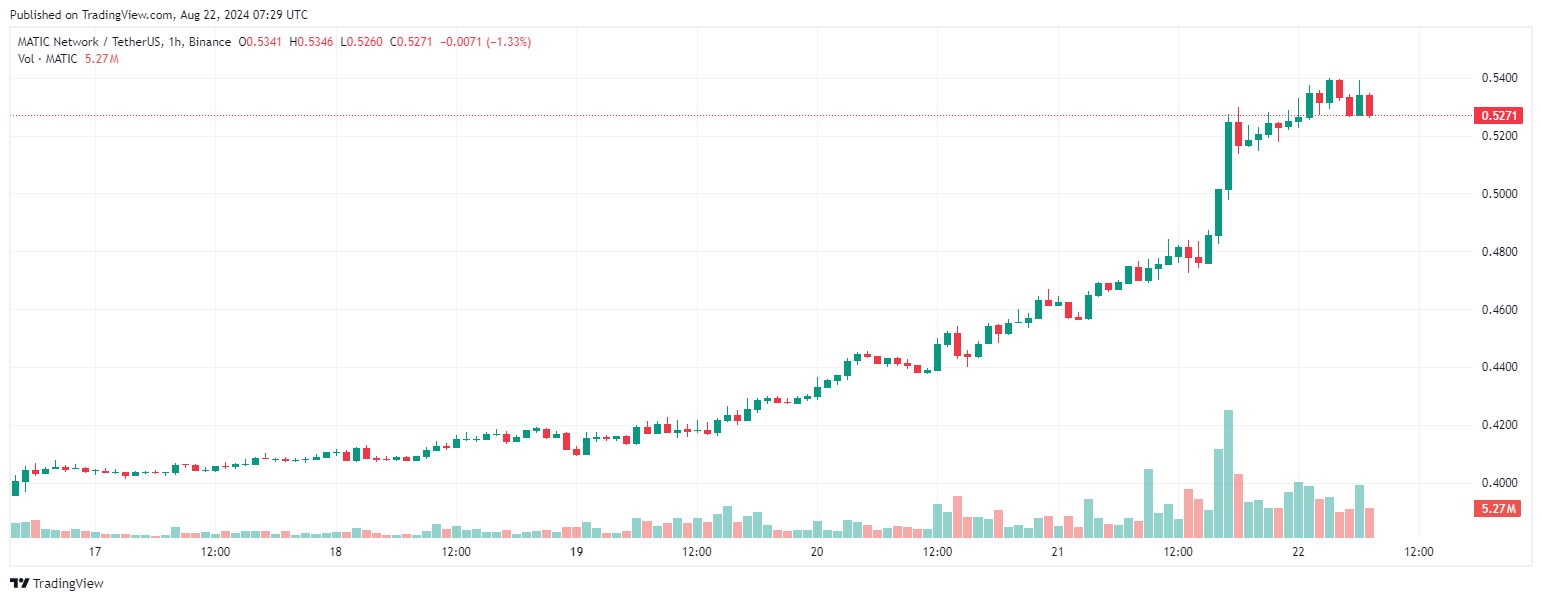
MATIC 1H Price – TradingView
MATIC Surpasses the Chief Resistance Level, Signaling a Resilient Bullish Trend

The current price of MATIC at $0.53 denotes a former resistance point. A chief indicator backing the respective bullish trend takes into account Ichimoku Cloud analysis. The price of MATIC has reportedly broken beyond the cloud. It is a technical indication of a resilient bullish trend to take place.
Apart from that, the Moving Average Convergence Divergence MACD histogram provides further support for this bullish trend. Such a crossover often paves the way for further price upticks. This signifies a potential continuation of the present trend if the respective conditions persist.
Trending Now: BaFin Raids 35 Bitcoin ATM Locations for Illegal Operation
Nonetheless, it is noteworthy that the Relative Strength Index is now standing at an exceedingly overbought spot of up to 75.72. As per the reports, the RSI offers a momentum oscillator measuring the change and speed of price actions.
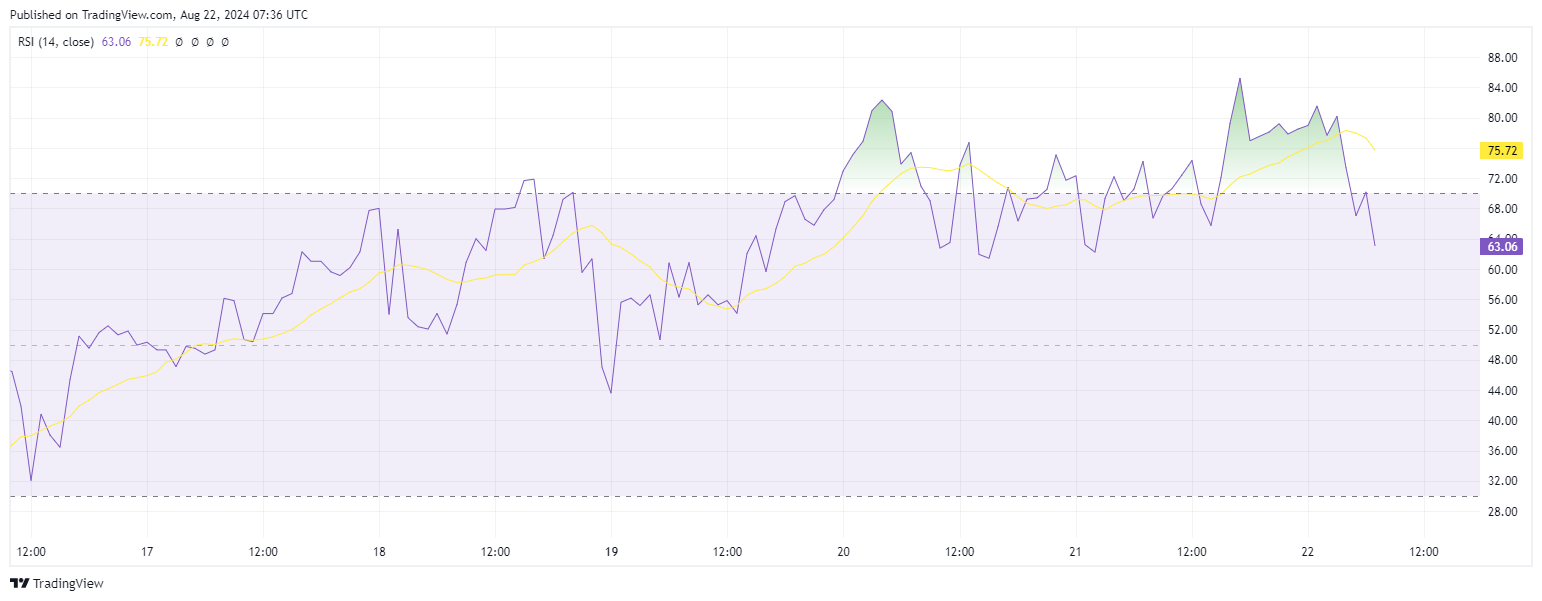
MATIC RSI – TradingView
If the RSI exceeds 70, it typically indicates the overbought status of an asset. Keeping that in view, the figure of 75.72 signifies a comprehensive overbought position. This suggests that a short-term price consolidation or correction might be on the horizon for the asset. Despite the resilient bullish momentum, the respective development is very crucial to take into account. Hence, a provisional price pullback may take place due to the overbought condition.
Traders to Target $0.60 as the Next Key Resistance Level for Capitalization
Nevertheless, MATIC’s overall trend displays a bullish outlook until the price remains above the breakout spot of $0.52. In this respect, the volume backing this upward movement is additionally massive. This shows robust rally participation. High trading volume also provides a positive sign, suggesting an open buying interest driving the breakout. Polygon MATIC could target $0.60 as short-term target, $1 as mid-term target and $1.5 as long term target.