
MCD Long-term outlook
MCD share prices down in October charge upward and gained 6.9% from $156.00 to $166.91 closing price. The upward movement continues in November and prints new record high at $170.92 before it reverses down to $169.11. The strong buying in MCD share prices resulted from the succesful restructuring of the company.
The company turned to old approach by selling its company-owned restaurant to franchisee brought back growth. Even though sales number decreased 6% over the past nine months, profitability increased to 38% from 33%. Traffic growth also sees positive development from -0.3% in 2016 to 2.1% in 2017.

The outlook stays strong for MCD and investors could hope more growth in the future.
Insider trading

It is the first time MCD CEO Easterbrook Stephen sold his shares this year in October. The sales valued $28.9 million while he exercised options of same share size valued $16.6 million. It is a $12.3 million profit from only exercising options.
Meanwhile, this sale at $168.32 might become notification for traders who are looking to buy above the exercise price. If the CEO thinks the share prices are topping out, it might happen soon.
Read McDonald October analysis
New Month
Monthly chart
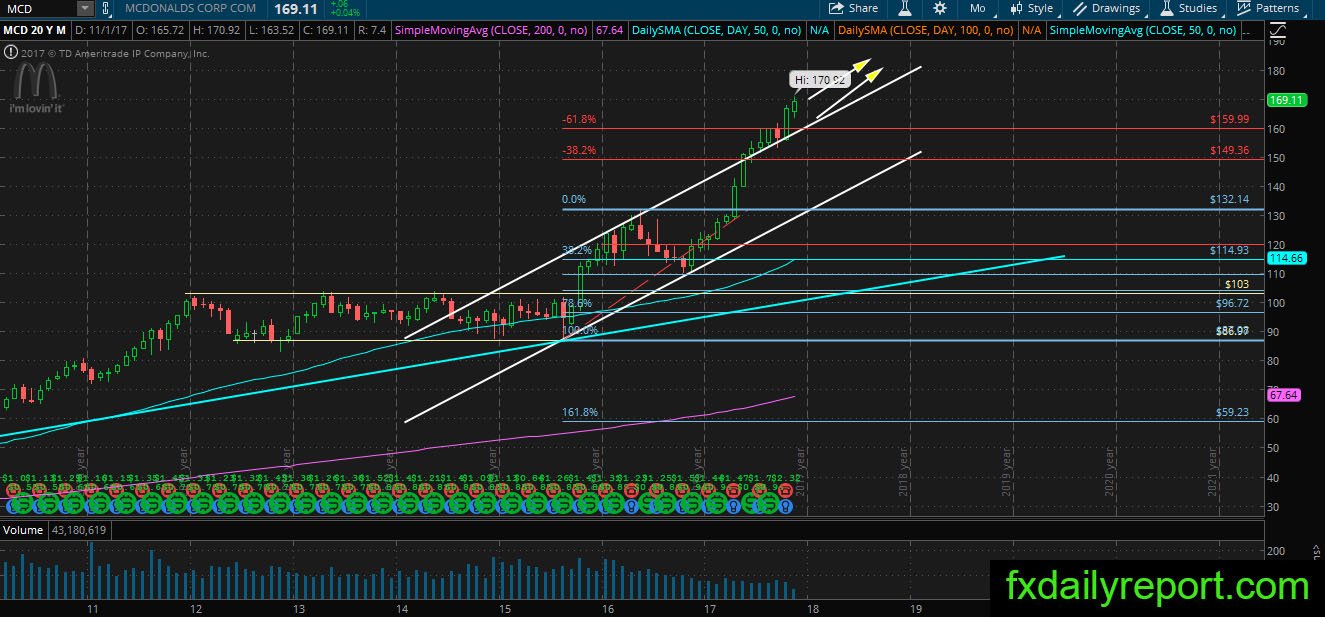
There is no reason to sell short MCD shares yet as the bull is in control and no bearish candlestick pattern on the chart yet. Traders could treat every pullback in the share prices as opportunities to take a long position.
Weekly chart

MCD upward trend on the weekly chart also shows no significant pullback. The share prices trend is bullish and no reason to take a short position yet. If the share prices make a pullback, the level around $160.00 is appealing level to take a long position.
Daily chart
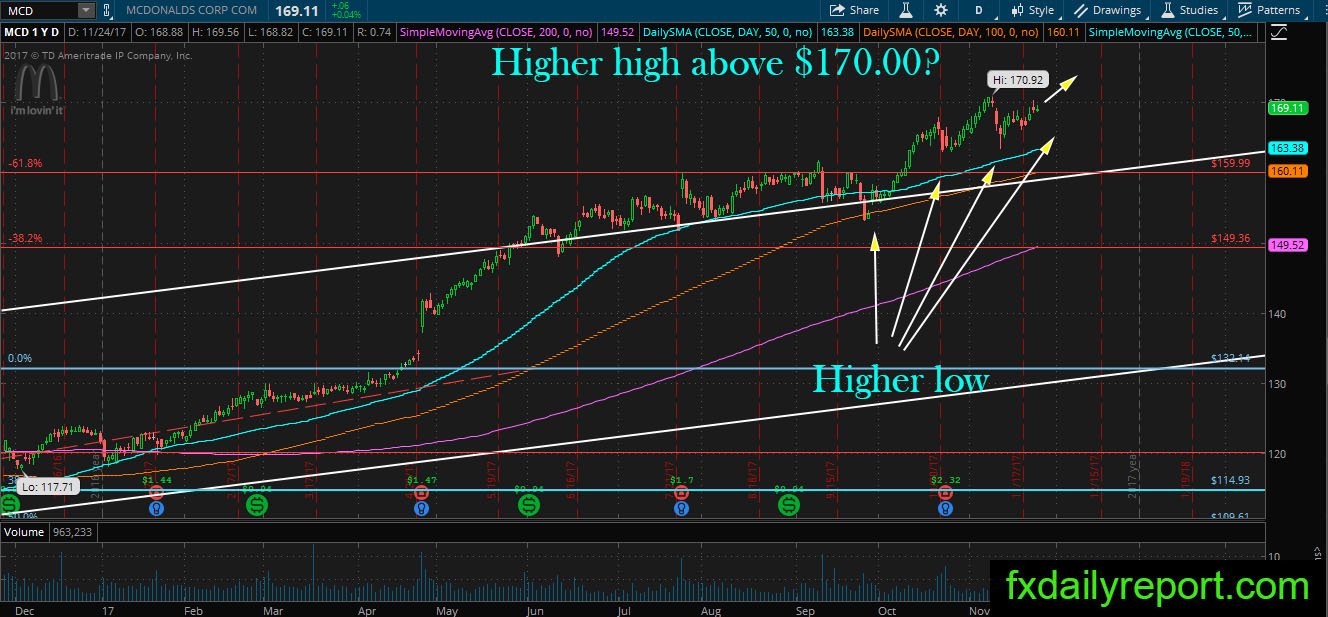
The trend on the daily chart also bullish with higher low and higher high printed on the chart. The share prices are currently testing $170.00 round number resistance. Traders might want to stay flat and enter a long position when pullback reach daily SMA 50.
Trade plan
The long position could be taken near $160.00 breakout level on the daily chart. (No change)
The short position might need to wait until major bearish reversal pattern formed on the monthly chart. The current trend is bullish, and it is better to avoid short position. (Same strategy as previous month)