
MCD Long-term outlook
MCD is unstoppable in August as the share prices hit record high $160 and continue in September. The bull is dominating the market, and there is no reason to sell MCD share prices yet.
The strength in MCD share prices derives from company decision to grow customers traffic by launching mobile order-and-pay function. The result from this decision extremely well received by the market especially younger population. The CEO said, 60% of orders placed from mobile and during the evening to late night which boost the company revenue aside from day time operation.

Overall, the long-term company prospect is bright, and business model focused on becoming majorly franchised. Currently, the company restaurant’s is 85% franchised and target to become 95% franchised by the end of 2017.
New Month
Monthly chart
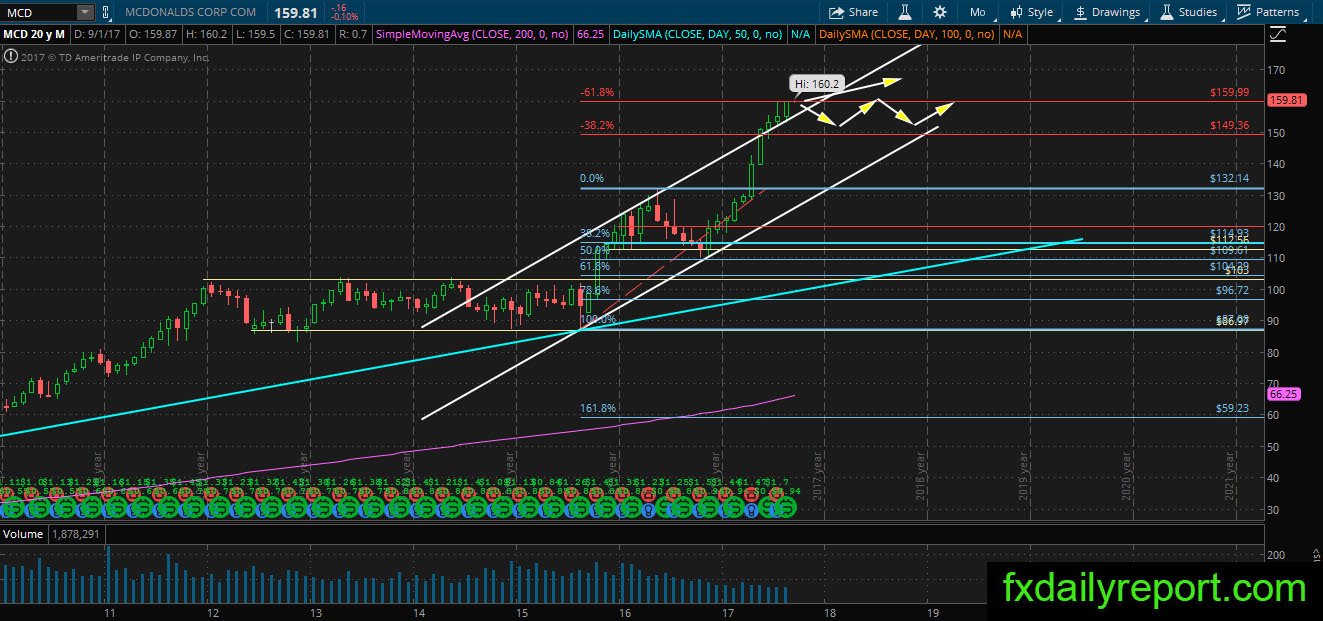

Previously on the monthly chart, MCD expected to hit the resistance and show weakness immediately. However, the share prices unexpectedly took a sharp break upside on the strong company financial result. The share prices move up past its uptrend channel and not stopping yet.
Drawing a Fibonacci extension level, MCD currently hitting 61.8% extension level
Weekly chart
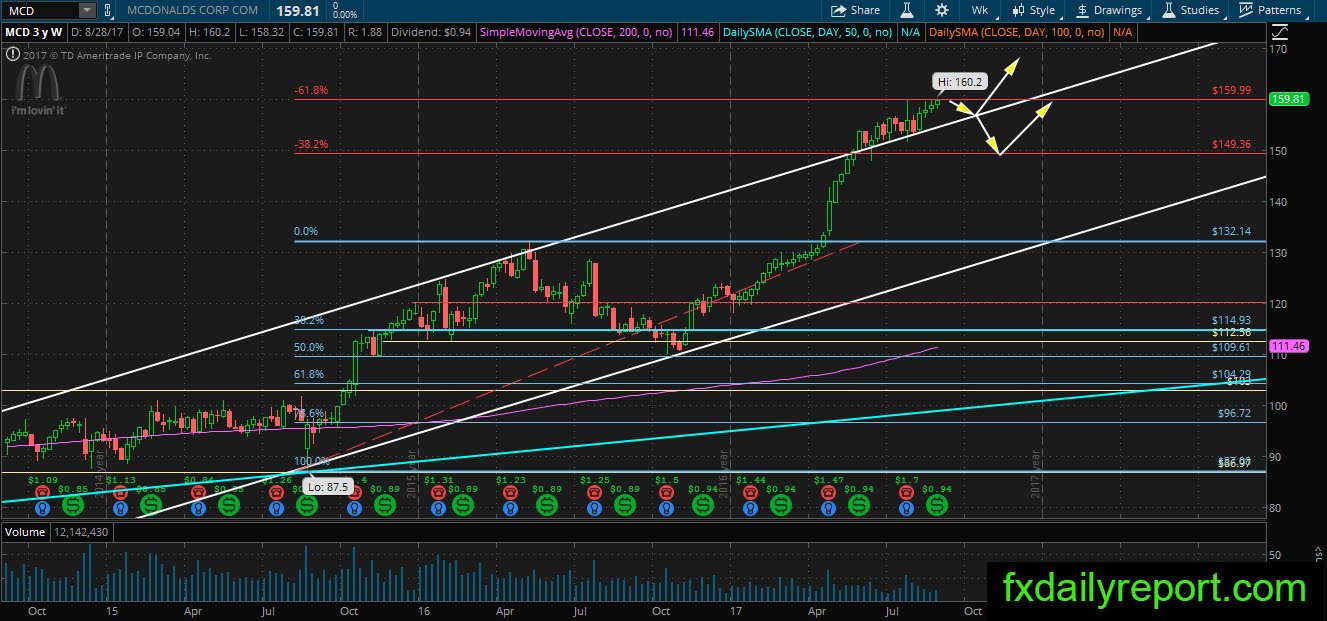
MCD on the weekly chart continues print new record high, and there is nothing to reverse the trend yet. It is better for traders to stay sideline and buy on a pull back rather than looking for a short position.
Daily chart
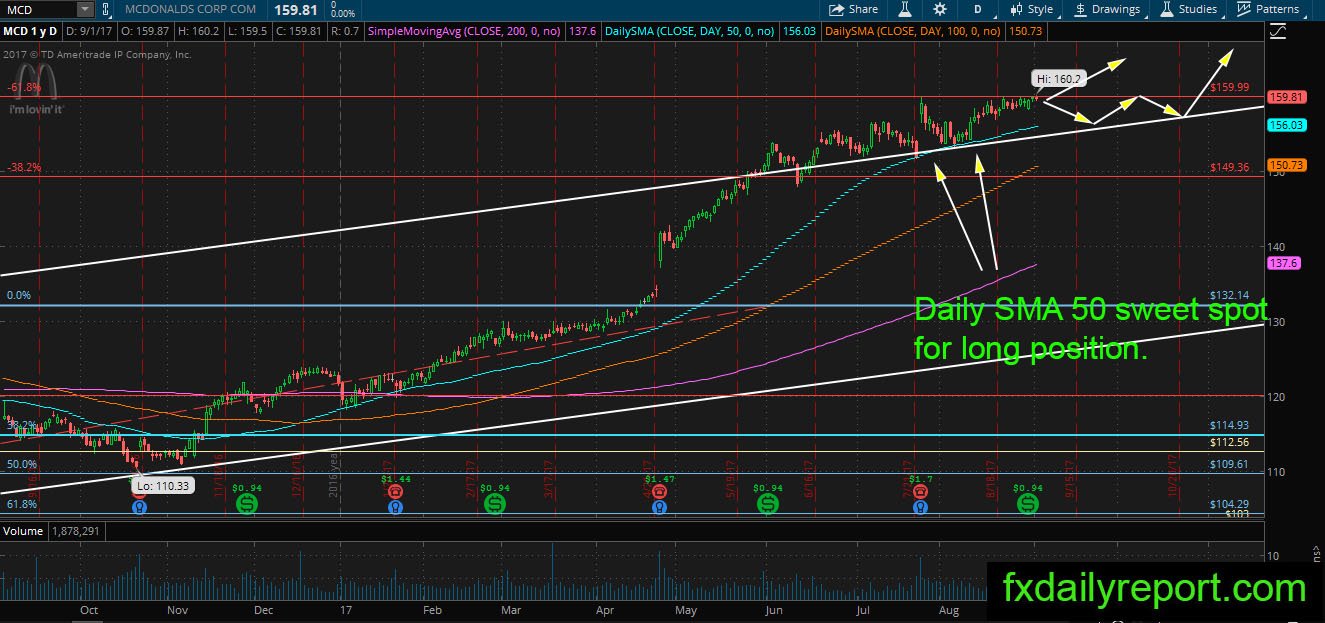
The trend on the daily chart is in-line with the weekly and monthly chart. We could see the best location to place long position is the daily SMA 50 where prices bounced two times from it. Meanwhile, if the price moves lower from the current level, traders could look for a long position at white line or daily SMA 50.
Trade plan
The long position opportunity present on the daily chart if the price makes correction toward daily SMA 50 or white line.
The short position might need to wait until major bearish reversal pattern formed on the monthly chart. The current trend is bullish, and it is better to avoid short position.