
MCD Long-term outlook
MCD starts moving lower in September and the downward correction manages to retrace more than 10% from the high. The share prices have three monthly bearish streaks and might extend it this month. If no bounce happens this month then traders could expect a further bearish correction.
Technologically, the company acquired voice technology company Apprente and onset to reduce their human staff in the drive-thrus which will reduce labor costs. However, the company also fired CEO Steve Easterbrook last month which cause uncertainties in the shareholder’s side.

We might see the share price normalization process for the short-term. At the end of the normalization process, MCD share prices expected to continue its upward movement for the long-term.
Read McDonald June 2019 analysis
New Month
Monthly chart

MCD share prices reached the bottom of the channel and previous swing high $190.88. It is a location where bullish bounce might happen. In the previous month, MCD manage to close above the level after the bearish test. If the bull could continue to maintain the position above the level then we could expect a bounce will happen.
Weekly chart
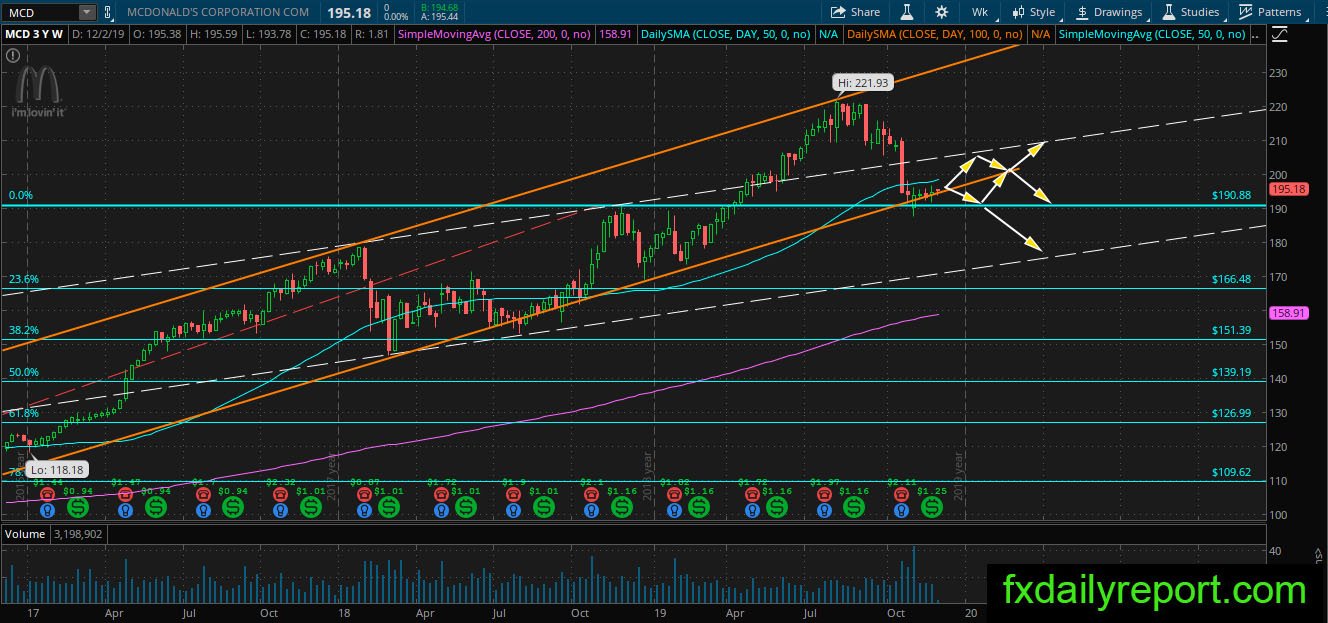
MCD on the weekly chart supported by the bullish channel and the $190.88 flip level. A bullish pattern formed near the level but no breakout above the candlestick high yet. Without major bullish momentum then MCD might continue to consolidate near the current level and may breakout below the support level. If breakout lower happen then traders could observe the white channel.
Daily chart

A close below daily SMA 200 is not a good indication for MCD bull. The share prices have not returned near the averages and the longer it stays below the averages the higher the possibility the trend will change. If a bullish bounce happens then SMA 200 also $200.00 handle will become the major resistance to watch.
Trade plan
Short positions could be considered when the share prices testing daily SMA 200 and the $200.00 handle.
Long positions need to wait for major bullish momentum formed in MCD. A close above weekly bullish candlestick also the first indication that the bullish trend may start.