
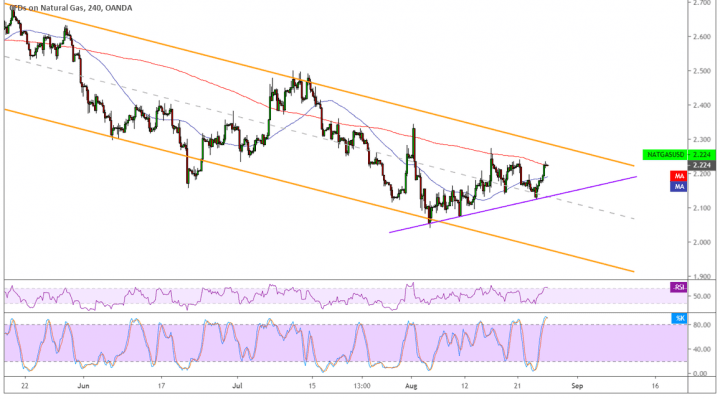
Natural gas has been trending lower inside a descending channel on its 4-hour time frame and is moving closer for a test of the top. Price is also trading above a short-term ascending trend line.
The 100 SMA is below the longer-term 200 SMA to indicate that the path of least resistance is to the downside. In other words, the selloff is more likely to gain traction than to reverse. The 200 SMA is holding as dynamic resistance for now and might be enough to keep gains in check.

If not, price could still test the channel top around $2.220 or even attempt to break higher. If this holds as resistance, natural gas might retreat to the ascending trend line support near the mid-channel area of interest.
RSI is heading up but approaching the overbought zone to signal that bullish momentum might fade soon. Turning lower could lead to a pullback to the nearby support zones or even the very bottom of the channel. Stochastic is already indicating overbought conditions or exhaustion among bulls, and turning lower could signal a return in selling pressure.
The improvement in market sentiment could be a factor that’s keeping natural gas prices supported, as the US and China might still be able to pursue negotiations for a trade agreement. As it is, both countries have imposed a fresh set of tariffs on each other and could keep a lid on business demand for as long as tensions persist.
Still, upcoming inventory data could determine where prices are headed next. A larger than expected increase in stockpiles could drive prices back down as traders worry about oversupply in a low demand market. On the other hand, a draw could signal that demand remains robust and could continue to pick up as colder weather conditions approach.