
Natural gas broke down sharply from the late-July swing high near $3.00, slicing through a rising trend line and its short-term moving averages to confirm a resumption of the broader downtrend.
The selloff dragged price all the way down to the $2.682 area before buyers stepped in, and the commodity has since been carving out higher lows in a shallow recovery.

That bounce, however, looks more like a corrective pullback than a full trend reversal, since price is now testing a descending trend line drawn off the July highs that happens to line up with the 61.8% Fibonacci retracement at $2.872. This confluence could act as a strong ceiling if the down move is simply pausing before another leg lower.
Below that, the 50% Fib lines up at $2.836 while the 38.2% level is at $2.799, just above current price near $2.766. A failure to clear these Fibs and the trend line together could set the stage for a slide back to retest the $2.682 low or lower.
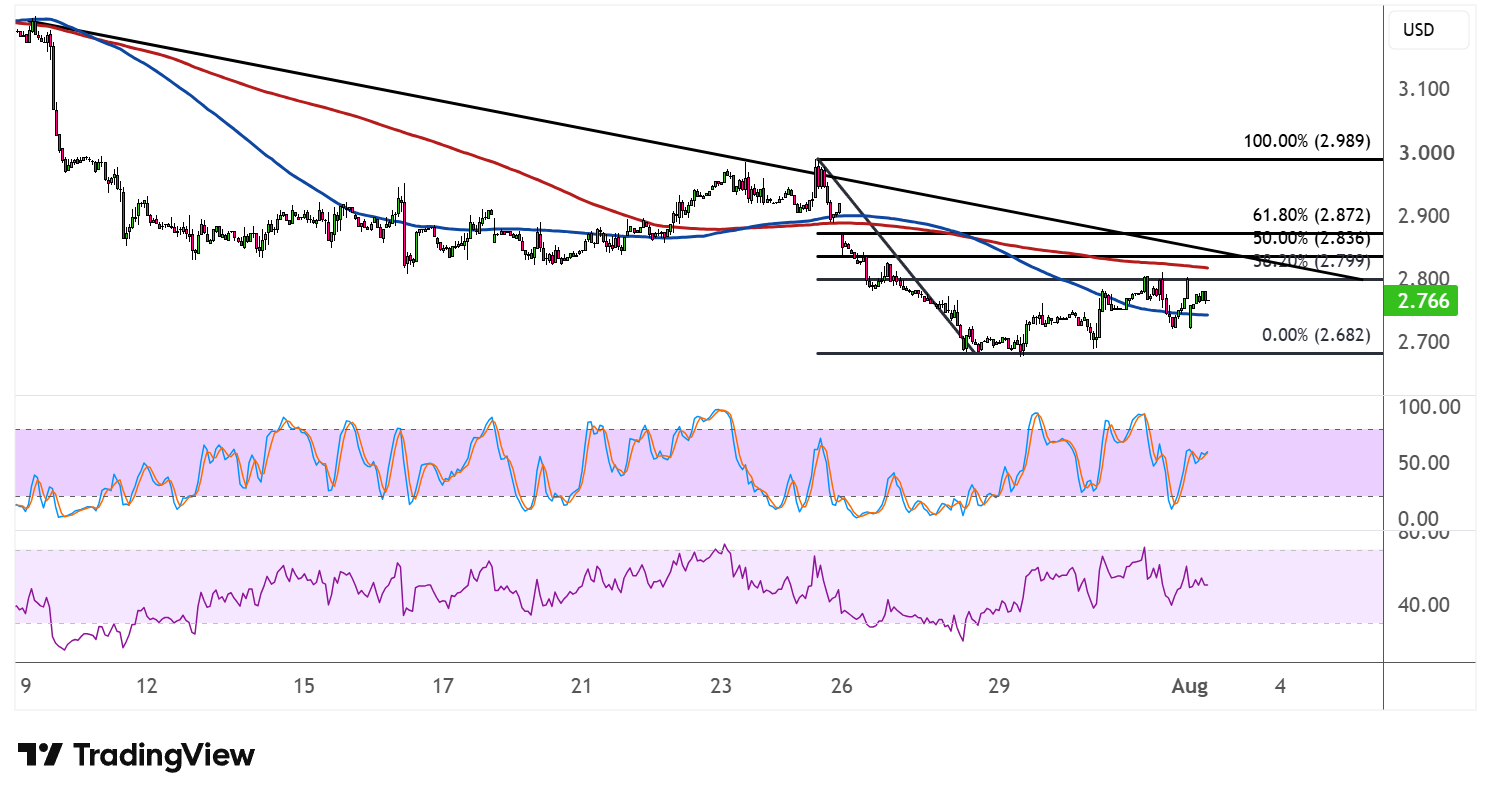
Looking at the moving averages, the 100 SMA has been curling below the 200 SMA, keeping the path of least resistance tilted to the downside, though the gap between the two has been narrowing as the recent bounce gains a bit of traction. A clean cross above the 200 SMA would be needed to shift the bias back to bullish.
Stochastic has climbed out of oversold territory and is pushing toward the overbought zone, reflecting the recent bounce in buying pressure, but it also means the oscillator has less room to run before a pullback in momentum becomes more likely.
RSI tells a similar story, with the indicator recovering off its own oversold reading but still has some room before hitting overbought, suggesting the recovery could have a bit more room before sellers reassert control at the trend line and Fib confluence.