
NKE Long-term outlook
The stock performance of Nike in 2016 has been underperformed the market as the shares declined almost 20% from $61.11 to $50.83. This decline contributed mostly from weakness in demand and loss of market share in the core business area which is the United States. The gloomy outlook looks to continue in 2017 as global market situation grow uncertain as President Trump enter the office previous week.
The first step taken by President Trump is the withdrawal from TPP (Trans-Pacific Partnership) deal. This decision spells out less opportunity from free trade while giving its biggest opponent, China to take hold of the trade opportunity. Although it is not clear yet what is the impact of withdrawal from TPP, U.S market will undergo a big major shift this year.

What will happen to Nike? It is not clear yet, traders and investors will know the impact in coming months. Overall the outlook for the company performance is not encouraging, as long as it cannot boost its sales in core business area. It will face another struggling year.
Click here to see NKE December analysis
New Month
Monthly chart
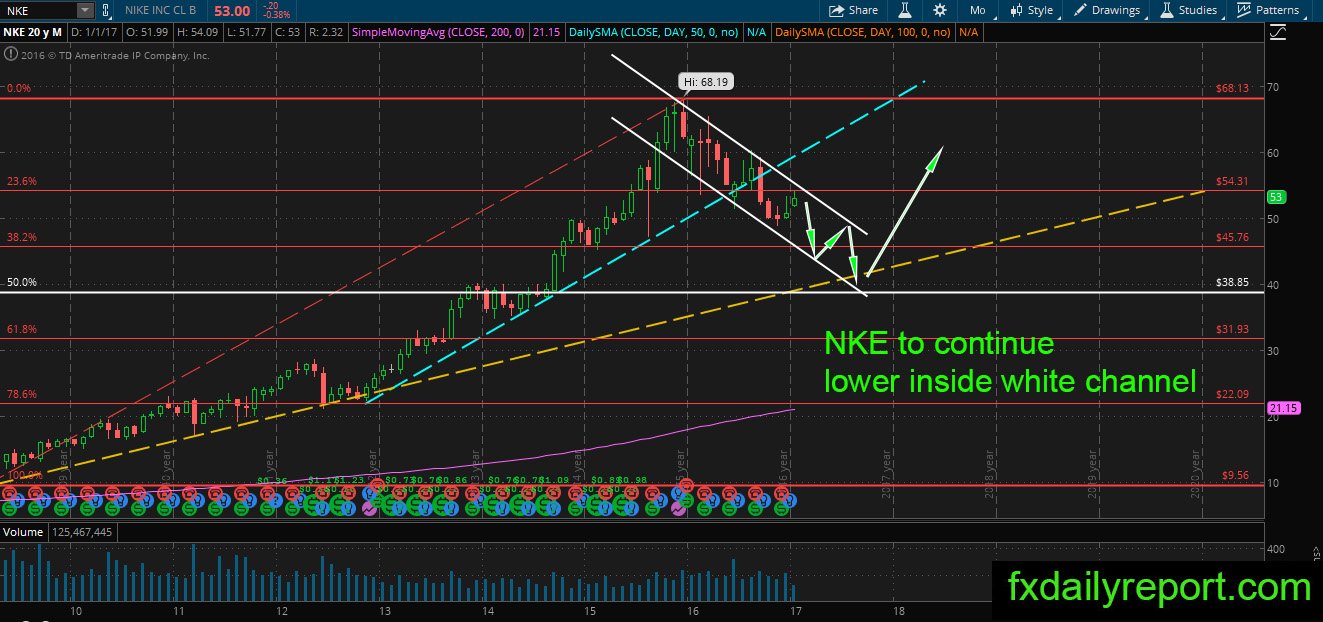
No reversal sign yet in the monthly chart. The price continues its descent inside the white channel, and it looks to continue in coming months. The price has target at the yellow-dashed trendline, this trendline will act as long-term support and provide resistance toward selling pressure.
Weekly chart
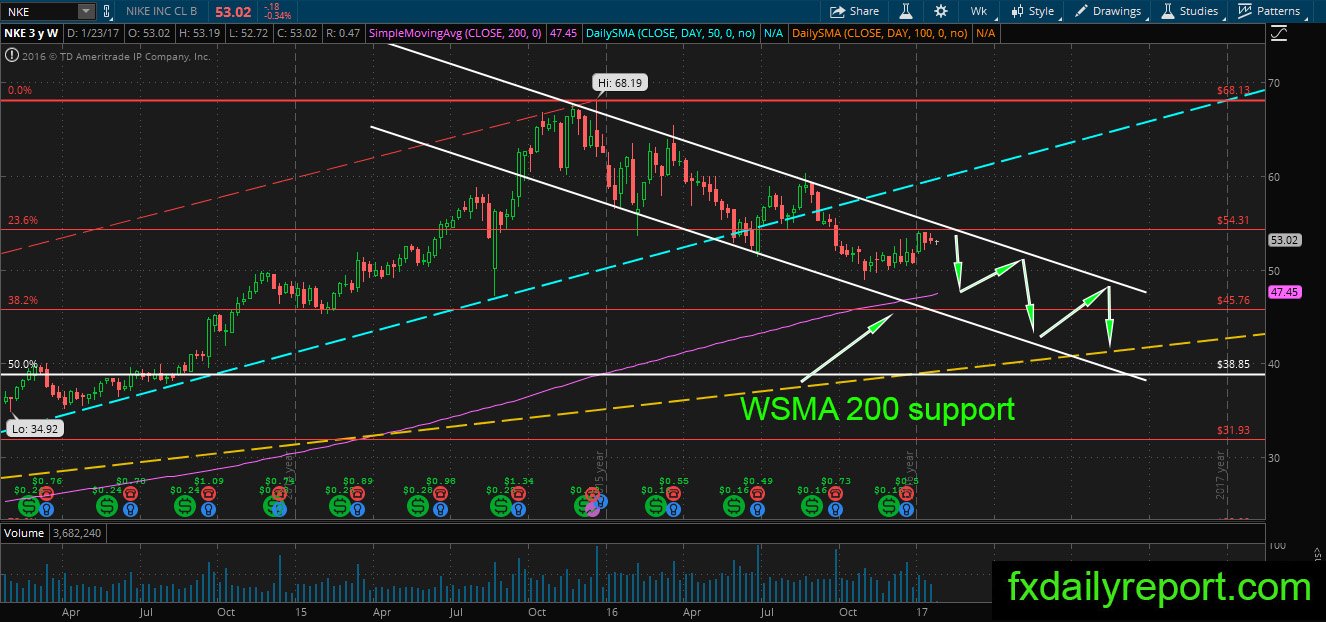
Since the break below the blue trend line, NKE has not returned once above it. The price will continue lower similar to the monthly chart, and nearest support is the WSMA 200 and bottom of the white channel. Long opportunity might be present when the price reach both support level.
Daily chart
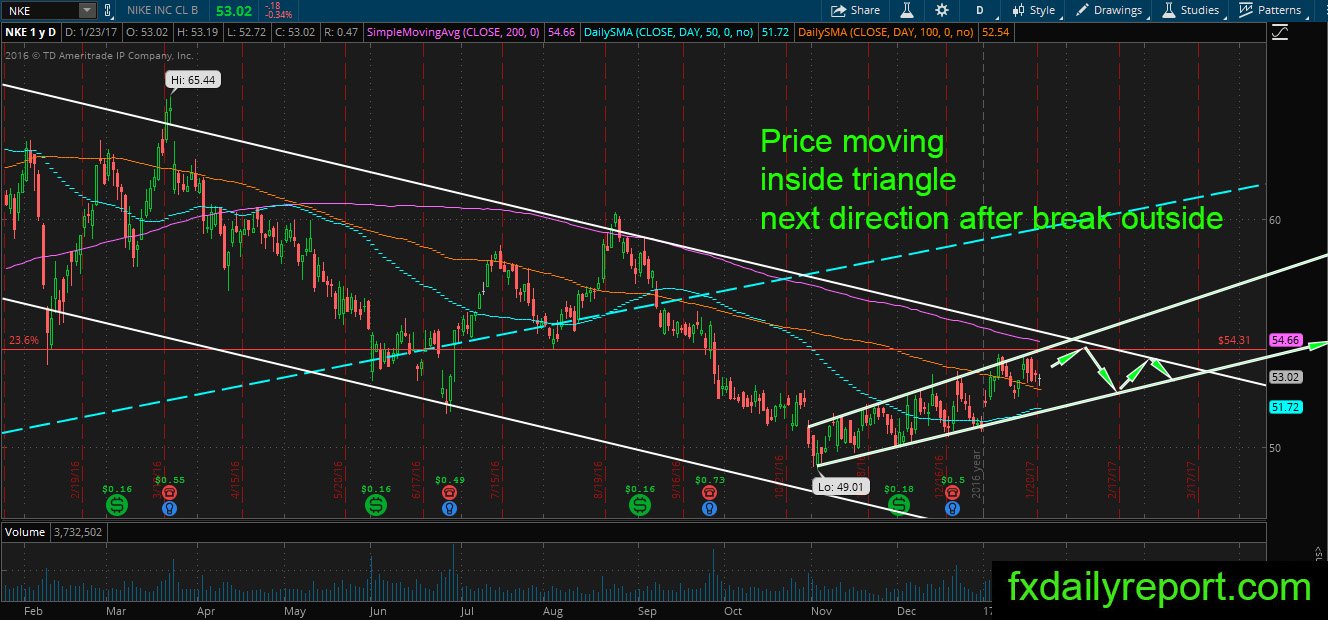
Despite the downtrend shown in the weekly and monthly chart, NKE on daily chart show promising mild upward momentum. The price is moving inside the channel and might wait for next direction until close either above the downtrend channel or below the daily support line.
Traders need to be careful though as the price still moving below its daily SMA 200 which is bearish.
Trade plan
Bullish position short term could be taken when price touched the lower part of the daily channel. Alternatively, better choice until the price break through daily SMA 200 and tested it.
Bearish position bests taken from the upper white channel and the daily SMA 200.