
NKE Long-term outlook
U.S and China trade wars is the heavy-weight for the company to lift. The apparel market is under pressure also the company projected possible loss from the exchange rate. In fact, Nike, as well as other big names, totaled 173 companies wrote to President Trump to reconsider his tariff against footwear made from China.
This month earnings report should provide traders with the future outlook of the company. Fundamentally, the company might continue under pressure if U.S-China could not reach agreement on the current trade issue.
New Month
Monthly chart

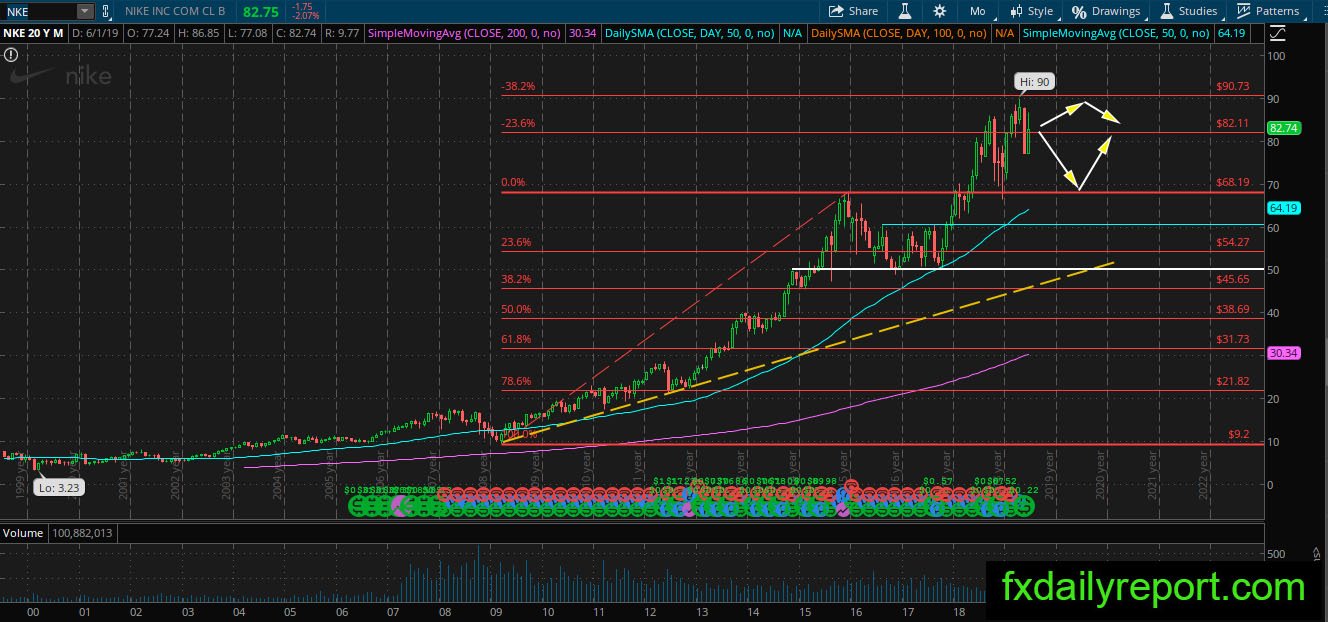
The overall trend of NKE on the monthly chart continue bullish with major bearish movement in the previous month. NKE drop below $82.11 and close the May trading month with a full bearish candlestick. In the current month, the share prices manage to climb above $82.11 but slowly losing ground. At the current time, the share prices might return below the level and close the month below it.
If a close below $82.11 happens then NKE might continue its bearish correction toward $70.00.
Weekly chart
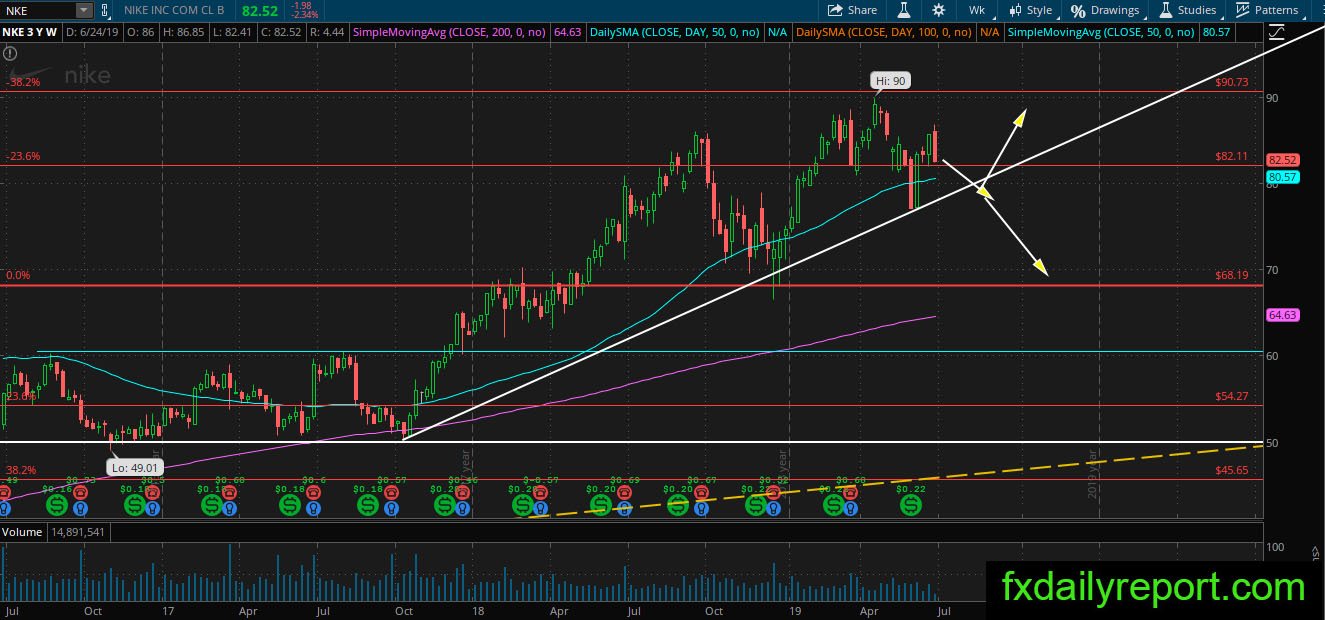
We have a bullish trendline on NKE weekly chart and the share prices not far away from it. In the latest week, NKE drifted lower but still maintain the level above the previous week low. If a bearish close below the previous week low happens then we will have a bearish engulfing pattern.
When the bearish engulfing pattern confirmed it will trigger further selling toward the trendline.
Daily chart

On the daily chart, we could see a possible bearish channel formed. The share prices have two points for each high and low which is an early indication. NKE currently drop toward $82.11 and might extend its weakness toward daily SMA 200. If a bounce happens then NKE might be able to avert the switch to a bearish trend. But, a close below the averages prompt for further selling.
Trade plan
Long positions: $70.00 is the ideal level to take long positions. On the short-term time frame, daily SMA 200 also appealing for long positions.
Short positions: Short positions best taken when breakout below daily SMA 200 and retest happen. Other possible short positions are when the share prices test the top of the channel on the daily chart.