
NKE Long-term outlook
In October, we mentioned about negative sentiment clouded Nike (NYSE: NKE) from fundamental side. Goldman Sachs downgrade and test of $50.00 multi-year lows is the theme of September and October trading. However, from the technical side, we also mention the share prices had a high probability of a bounce from $50.00 and reached $60.00.
In November, traders could find the share prices just less than $1 from $60.00. The bullish sentiment coated by the analyst from major website suggesting bull trend could continue and encourage traders to enter a long position. While it is true the bullish trend could continue, it is not a wise idea to suggest traders buy near the resistance level where the risk of price reversal extremely high.

Another idea which is safer for traders: Wait until breakout above $60.00 and trade the re-test of the broken level.
Click here to see NKE October analysis
New Month
Monthly chart
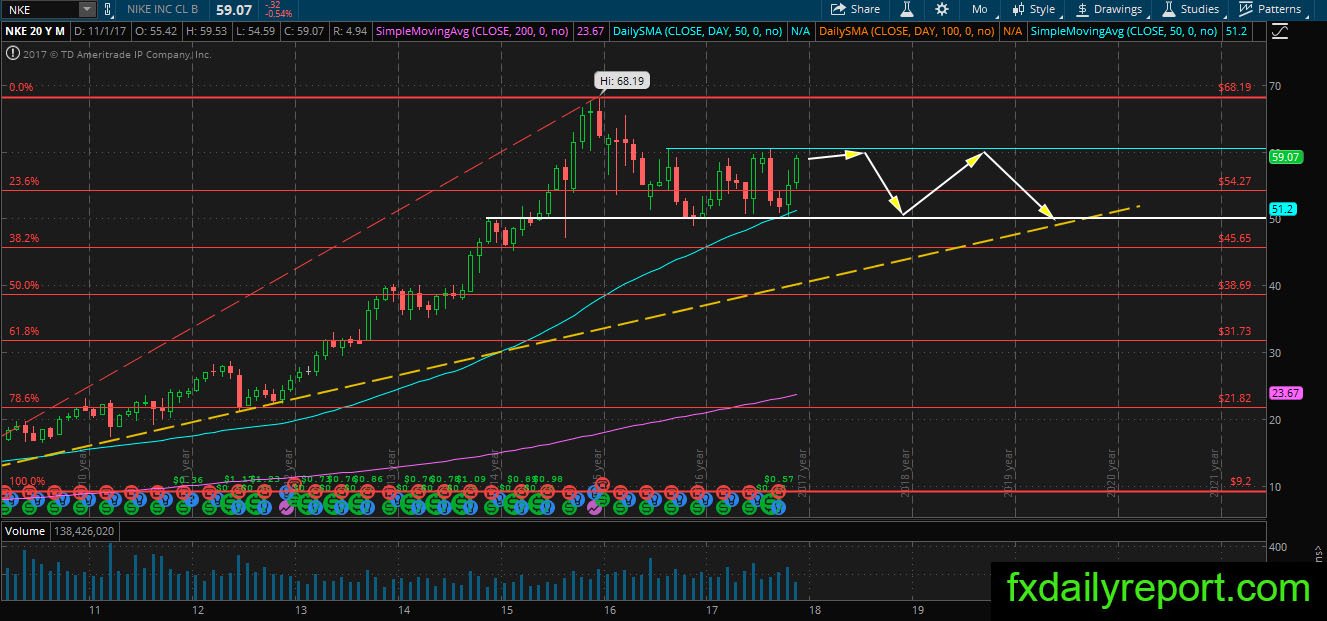
NKE bounced from support $50.00 and headed to $60.00 resistance. Overall, the long-term trend is bullish, but the share prices have been trapped inside $50.00 – $60.00 range for almost 1.5 years. Without strong momentum, we could expect NKE continue its sideways movement between $50.00 – $60.00.
Weekly chart

NKE on the weekly chart has the same outlook as the monthly chart. We could see the share prices previously bounced from the weekly SMA 200. Traders will wait for the result of $60.00 test before placing positions.
Daily chart
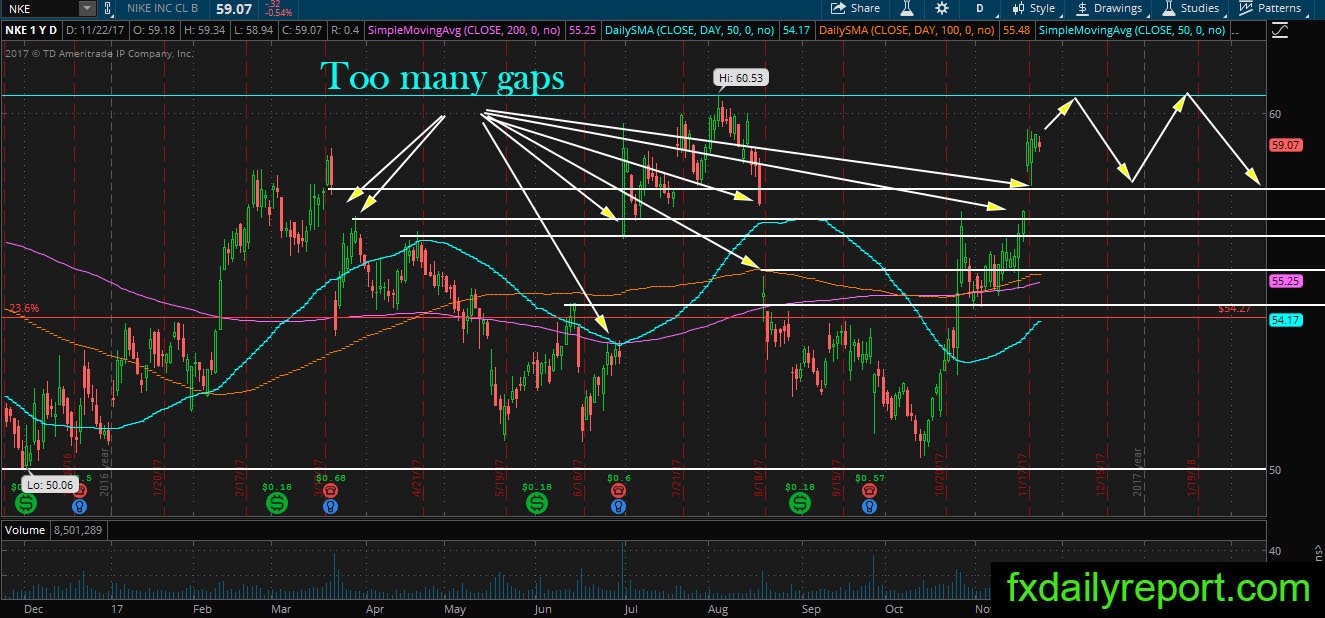
NKE daily chart show many gaps produce in the previous earnings report. It means traders and investors being jumpy in the company as earnings result unpredictable. One fact traders could hold:”Gaps always filled on NKE daily chart.”
If NKE reach $60.00 and the share prices show exhaustion pattern, traders could expect the share prices could fell and closed the latest gap around $57.20
Trade plan
The long-term bullish position might need to wait until the share prices hit $50.00. Daily SMA 200 and WSMA 200 is level to consider for shorter-term trade.
The bearish position could be taken near $60.00 resistance.