
NKE Long-term outlook
Nike (NYSE: NKE) experienced more selling in September and initial October which lead the share prices down near $50.00. The situation is not favorable for the bull, especially when Goldman Sachs award the company with a downgrade on 19th October. Goldman Sachs downgraded rating for NKE from “Buy” to “Neutral.”
The downgrade comes after inventory assessment. Goldman thinks Nike high level of inventory in its brick-and-mortar stores will lag the company as they need to clear it out with discount. A Recent partnership with Amazon listed some items, but there is possibility Amazon will enter the athletic apparel with its own brand which put risk to NKE.

Nike will hold an investor day on Wednesday, 25th October. It looks like no positive long-term outlook to report while there are more negative issues surrounding the company to discuss.
Click here to see NKE September analysis
New Month
Monthly chart
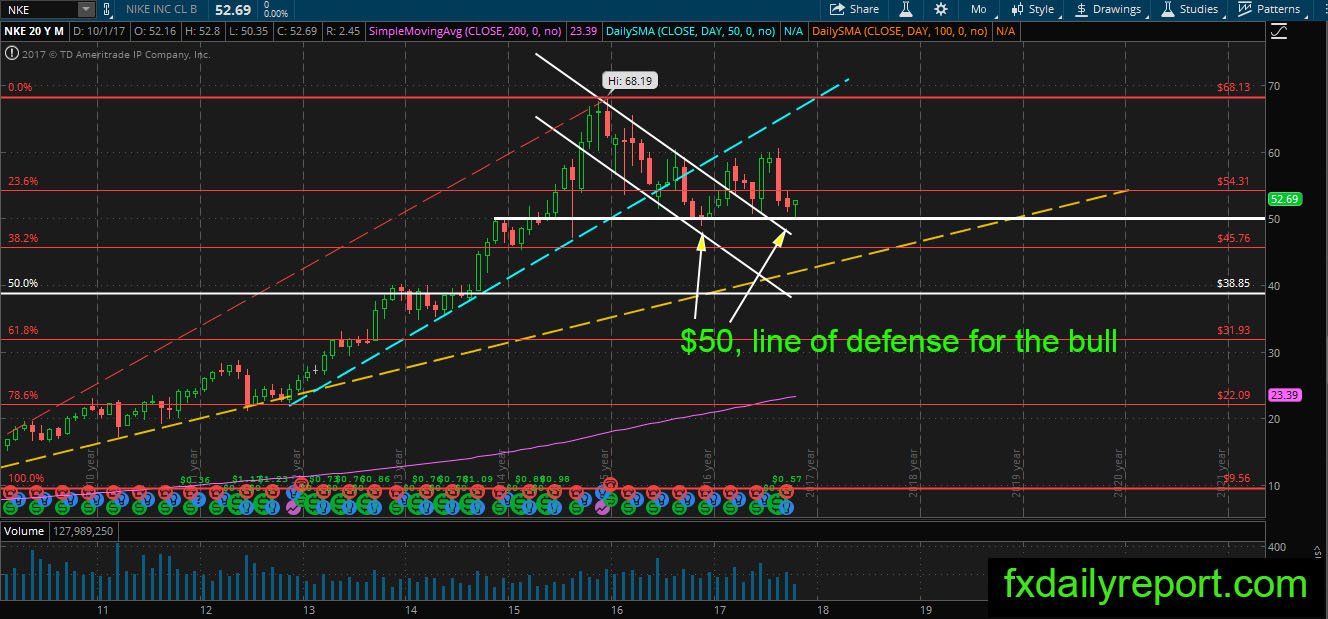
NKE upward movement after the bounce from $50.00 losing momentum and reversed in August. The share prices continue lower in September. Although it looks bearish, there is no lower low printed on the NKE chart which means the situation “Safe” for the bull. On October, the bear test $50.00 support level and the price bounced. If the bounce could continue higher and Surpass August high, it is possible for NKE to head higher.
Weekly chart
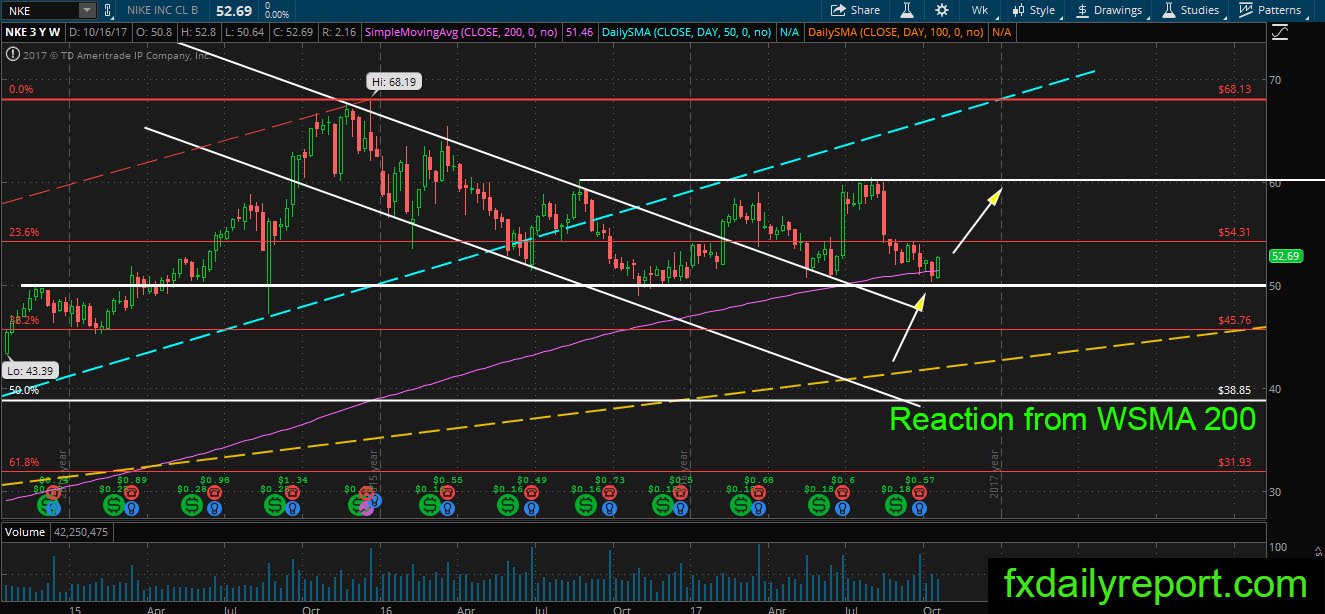
NKE on the weekly chart supported by $50.00 and the weekly SMA 200. There is range established between $50.00 – $60.00 on the chart. Traders could expect the bounce from $50.00 might reach $60.00 without any change in the current situation.
Daily chart
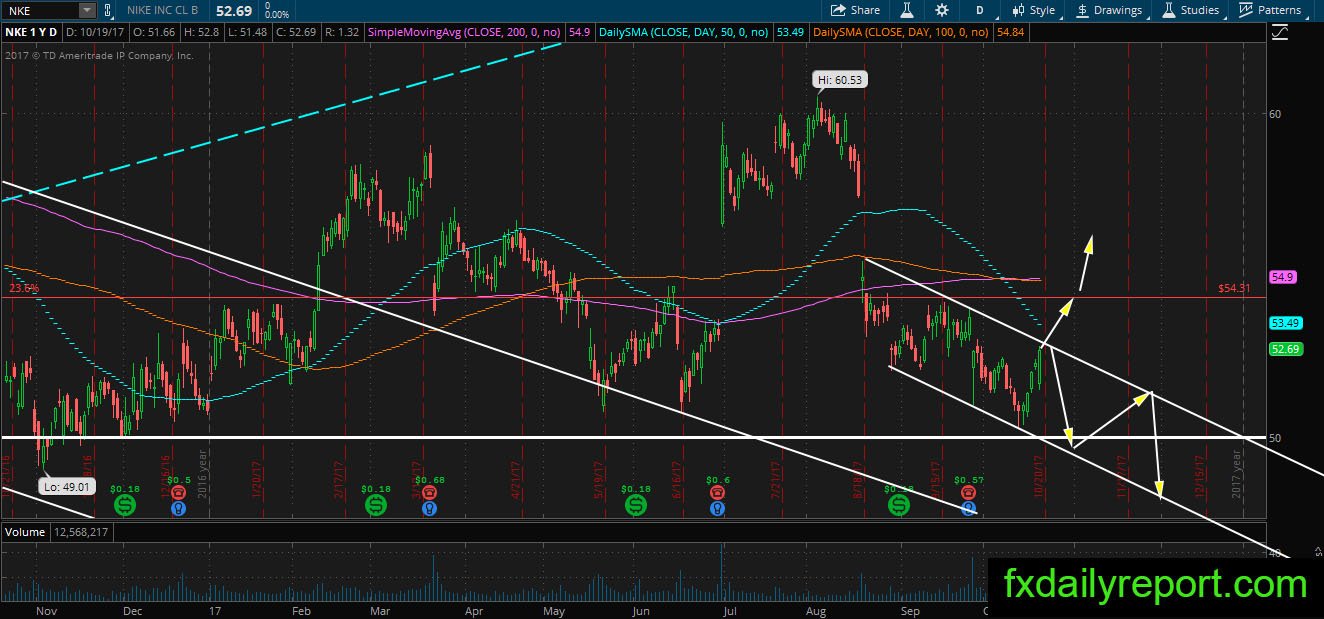
The trend on the daily chart obviously bearish as the share prices down below the daily SMA 200. Currently, NKE trapped inside the bearish channel and the price is testing the top of the channel. Rejection from the channel will lead NKE down to test $50.00. On the other hand, a break above the channel will open the way to daily SMA 200.
Trade plan
The bullish position is best taken near $50.00 or after the break of price above daily SMA 200.
Bearish traders could use daily SMA 50 or the bearish channel top on the daily chart to place short position.