
NKE Long-term outlook
U.S-China trade war is not favorable for NKE as the company manufactures its goods in China. Aside from the trade war, The Fed decision to further tighten interest-rate shaken the market in October and lead the market down. We have no positive news for the moment and share market seems will continue under pressure at least under the end of the year.
Nike is the talk of the analyst in the market and many think the company has turned to a technology company. The company ramped up its digital sales to overturn the supply problem in recent years. The shift to enhance digital presence turns out fruitful. However, September is the month when President Trump intensifying pressure with China. Sales data, company financial performance and the sector situation reported in October will heavily influence the share prices movement.

Traders will look at fundamental data this month and deciding to stay defensive or start accumulating equity positions.
New Month
Monthly chart
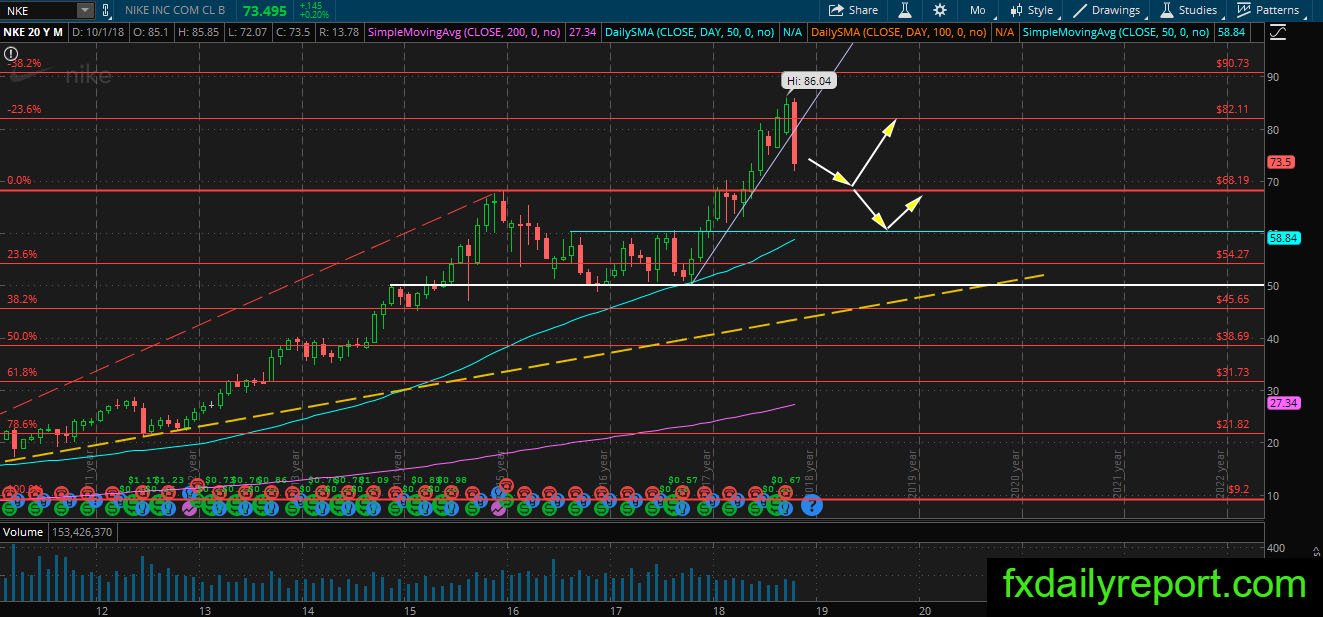
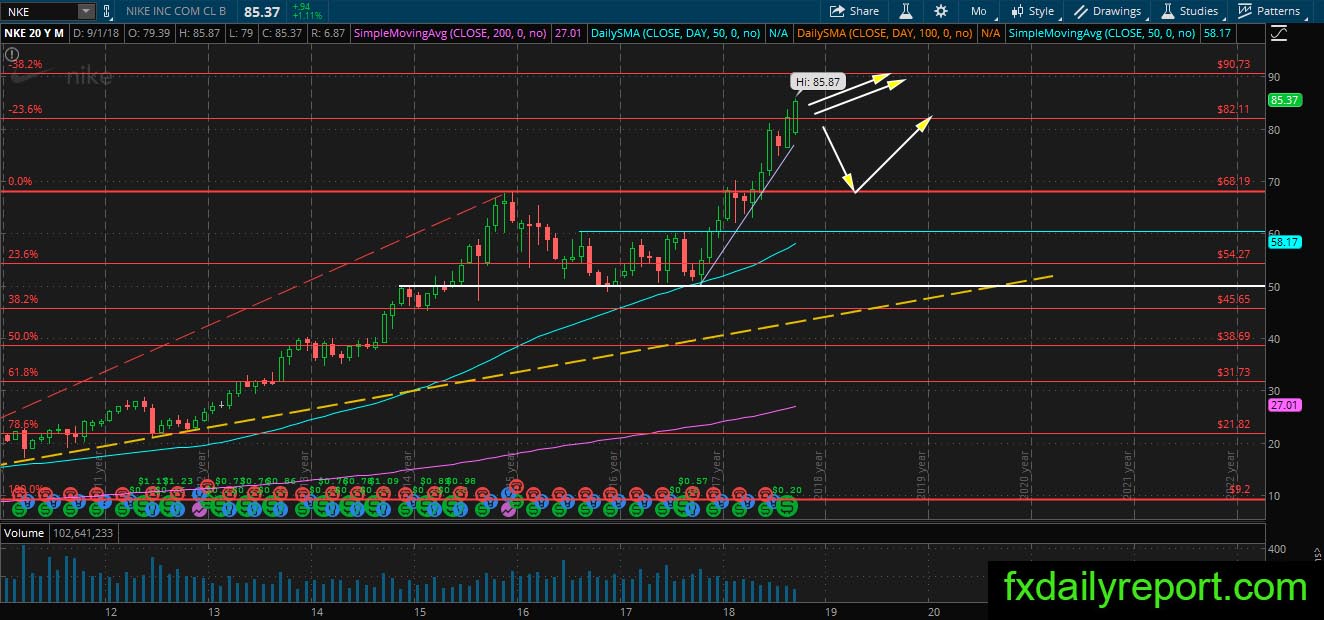
A sharp reversal happened in NKE share prices despite the bullish close in September. It is caused by a pullback in global shares market as trade war situation intensified. Although pullback looks serious, it could also mean bullish traders could enter a position at a lower level.
Following our analysis in September, $70.00 is the prospective level to watch for a bounce. Another level to watch is $60.00. However, current selling momentum is strong and traders might want to refrain from placing major long positions.
Weekly chart

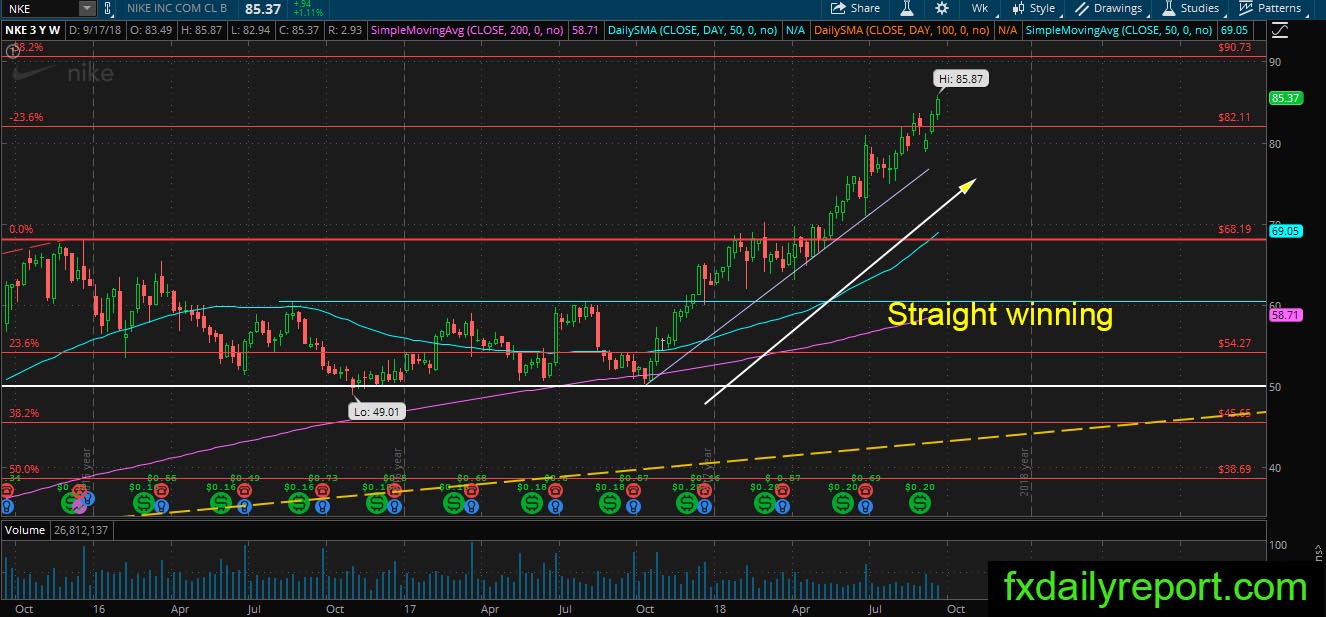
NKE could not extend the straight winning on the weekly chart and broke below the bullish trendline. The breakout sends the share prices down to test the weekly SMA 50. There is a minor bullish reaction before the price touch the averages. It is possible the bear will continue to push NKE down before any bounce happen.
Daily chart
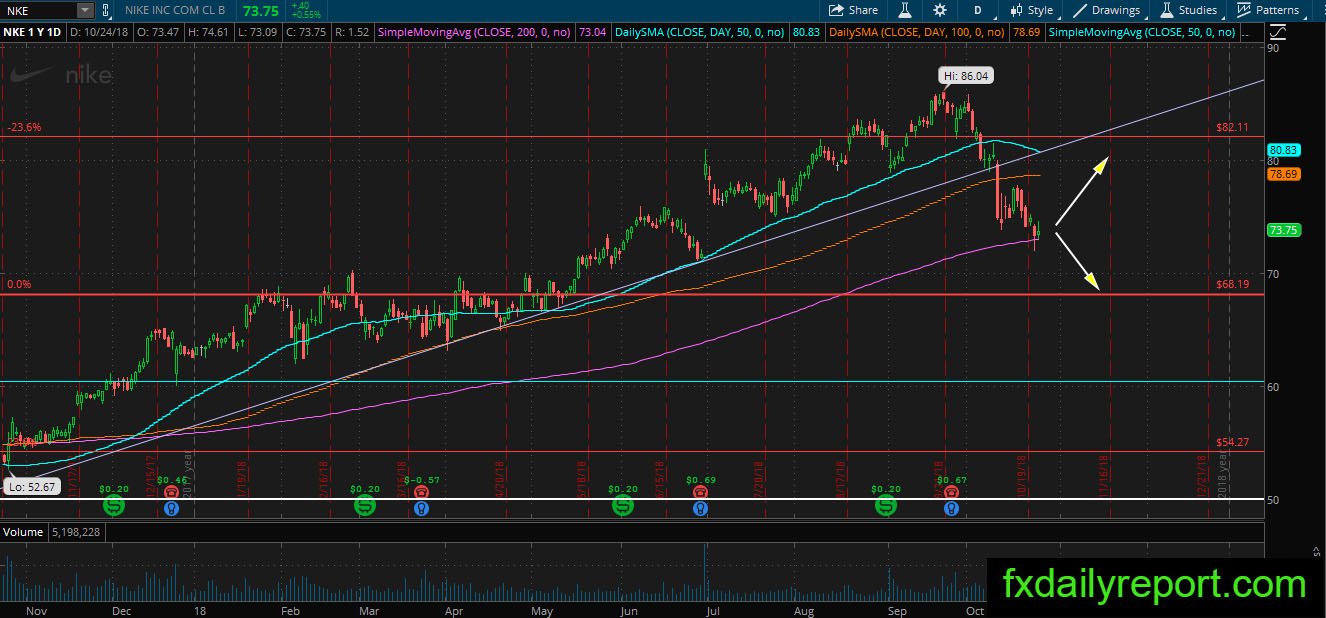
The monthly chart and weekly chart of NKE show prospective chance for the bullish scenario, but on the daily chart NKE barely holds out above its SMA 200. A little push from the bear will make the price slip and turn into a long-term bearish trend. At the current time, traders will monitor the share prices action near the daily SMA 200.
Trade plan
Pullback happened and long position become possible. We still favor $68.19 breakout point as the strong level to watch.
The bearish position might need to wait for a clear breakout below daily SMA 200.