
NKE Long-term outlook
Nike (NYSE: NKE) share prices down strongly in August from high $60.53 to $52.56 which is down 13.16%. Even though the share prices relatively cheap and oversold, analyst and fund manager stay indifferent on the share prices. The action taken by traders and investors on Nike is noteworthy. The company business trend is negative, and this could be seen on other retailers also such as Adidas, Finish Line, Foot Lockers getting slapped by the market.
Lack of innovations, excess in inventory, lower demand as the public lack of enthusiasm contributed to company problems. Analyst project Nike share prices have more room toward $40.00 which could disappoint the bull. However, as long-term traders, this could be seen as an opportunity as lower share prices mean lower price to enter.

Click here to see NKE March analysis
New Month
Monthly chart

NKE on the monthly chart fall to the critical level where previous July bullish engulfing candlestick present. Also, there is trend line which project will provide support to the share prices. If NKE bear blows away the support level, it looks like the share prices could fall to the yellow trend line.
Weekly chart
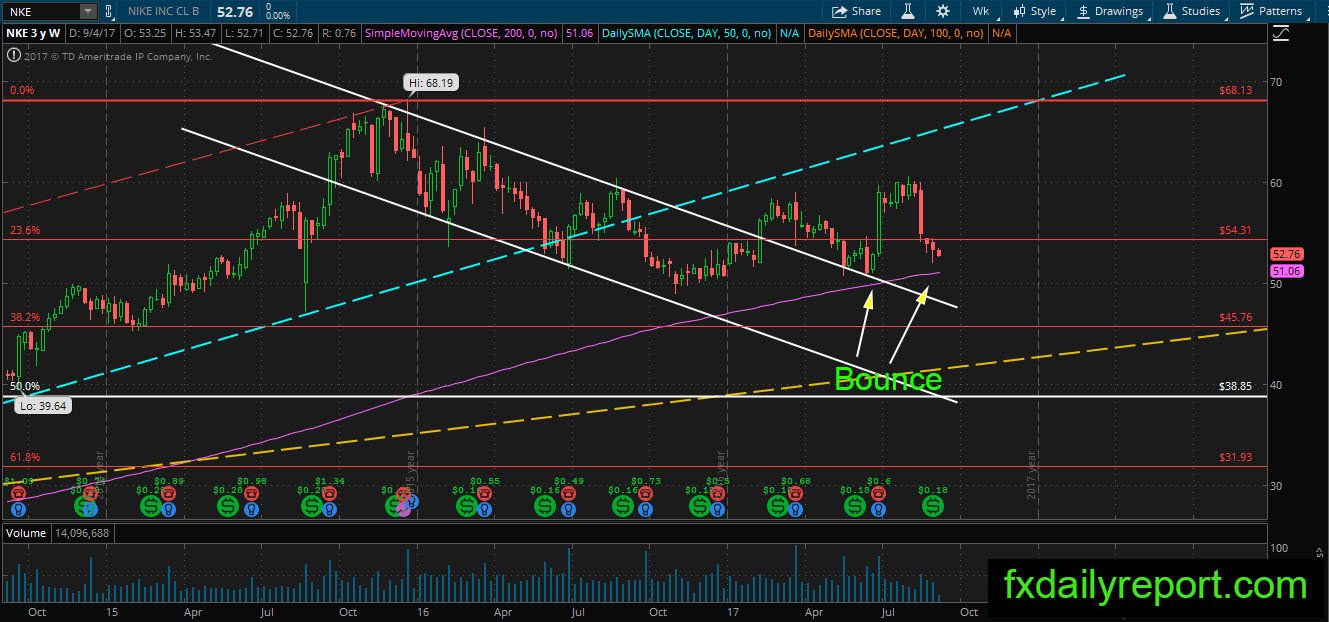
The white channel on weekly chart was tested, and the bull brought the share price higher. Unfortunately, there is no follow through as the price hit $60. The bear returns to the market and pushes NKE down. It is currently moving near the weekly SMA 200, will it bounce from the support level?
Daily chart
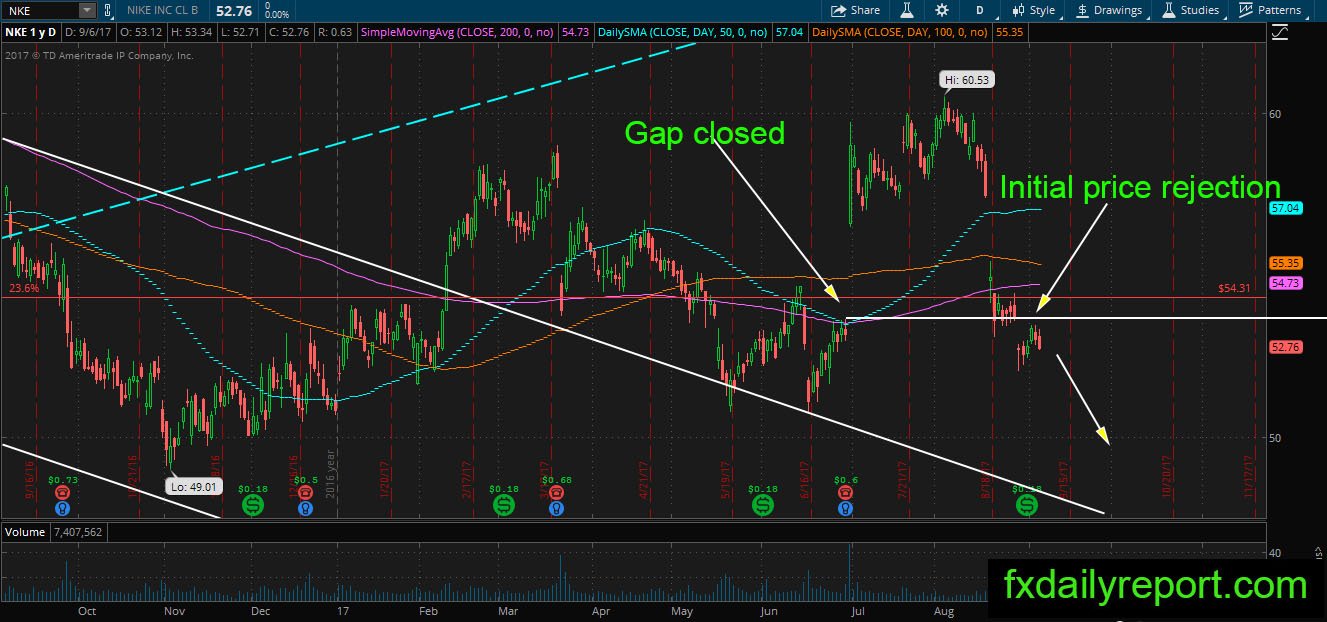
Although the weekly chart and monthly chart provide hope for a bounce, the damage on NKE daily chart is severe. The share prices gapped down and closed previous earnings gap. Moreover, as the share prices attempt to recover, it experiences rejection at the “Closed gap” level. It looks like NKE could fall further.
Trade plan
The bullish position needs to wait until the share prices closed above gap level shown on the daily chart.
Bearish traders could position themselves if there is downward momentum from the current level. Another location to look for a short position is the daily SMA 200.