
NKE Long-term outlook
What happened to Nike? why the share prices could move up sharply this year especially when the company faced trouble over piling inventory. The answer is the company commitment to assure its investor that it will return to growth and NKE has proven it.
NKE switch to direct-to-consumer sales through Nike apps, also the partnership with Amazon, JD.Com, and Facebook helped to boost the company sales. On the company report, Nike said Nike Direct deliver 90% of company growth in 2018.

The goods news is worth to celebrate, however U.S-China trade wars also an issue to watch. If the trade war stretches for long and continues intensifying then we might see some dent in the Nike revenue.
New Month
Monthly chart
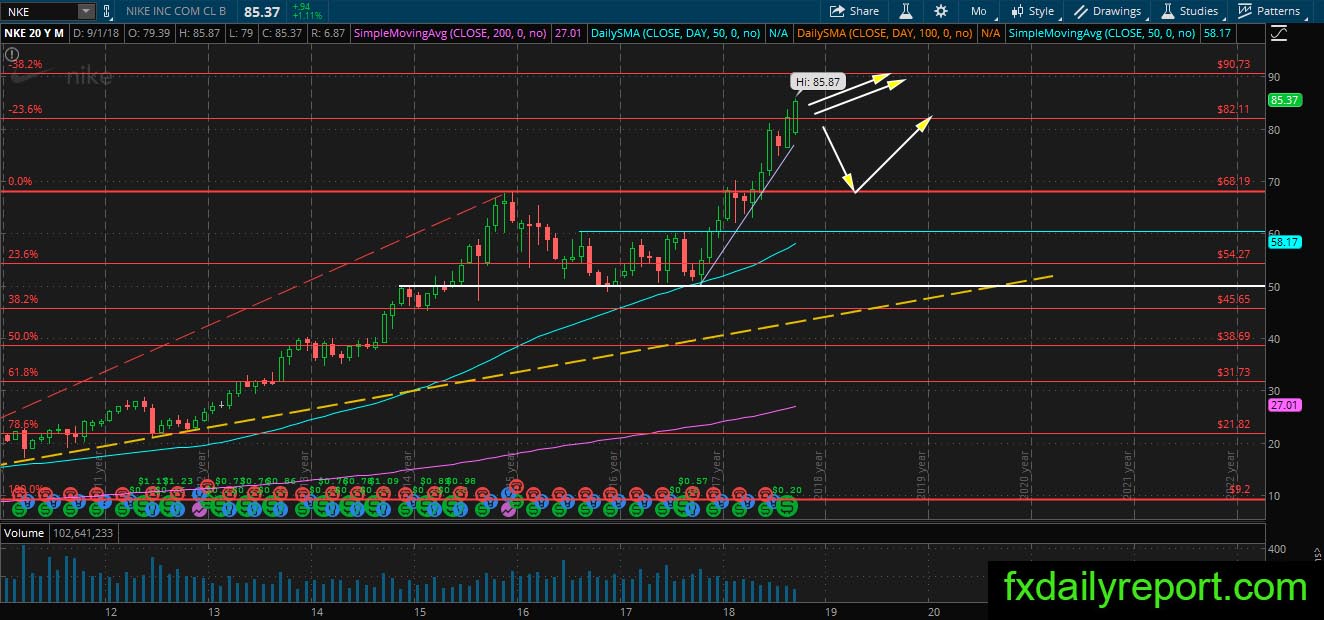
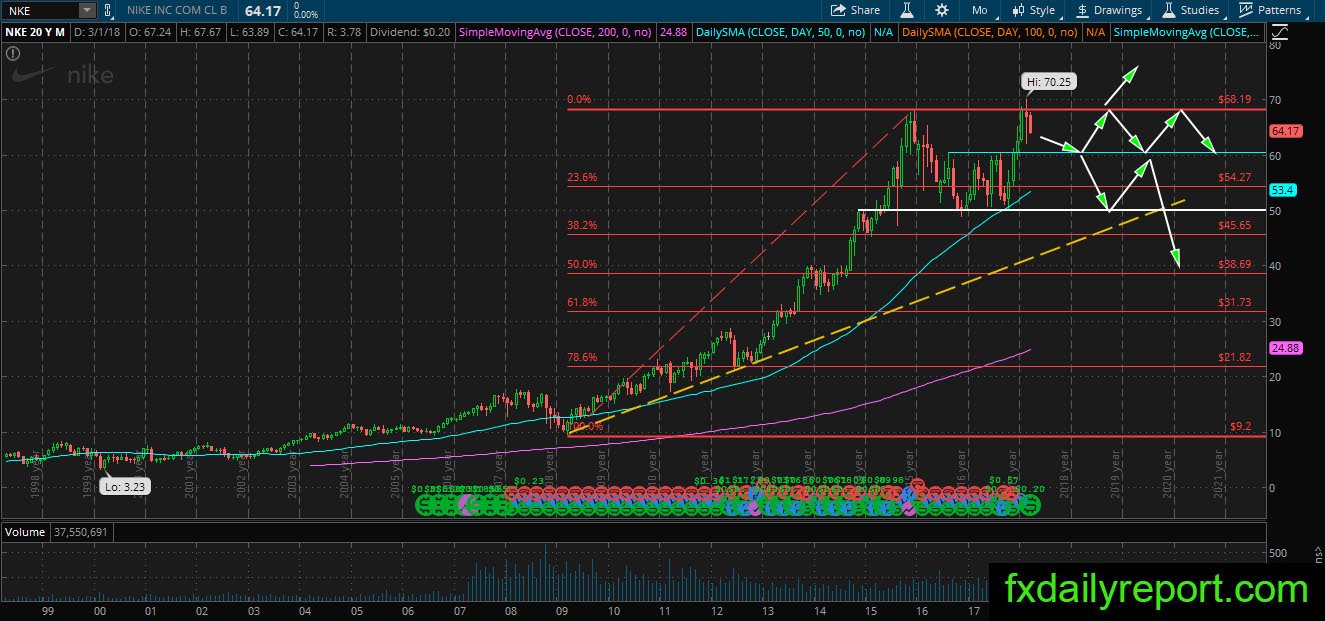
NKE breakthrough above 2015 high brought the share prices to a level never seen before. We could see the share prices gained from $68.19 breakout level to as high as $85.87. It is an equal of $17.68 or 25.92% gain. However, if we calculate from $50.00 where the rally started, this mean NKE has gained at least 71.74% since 1-year ago.
Weekly chart
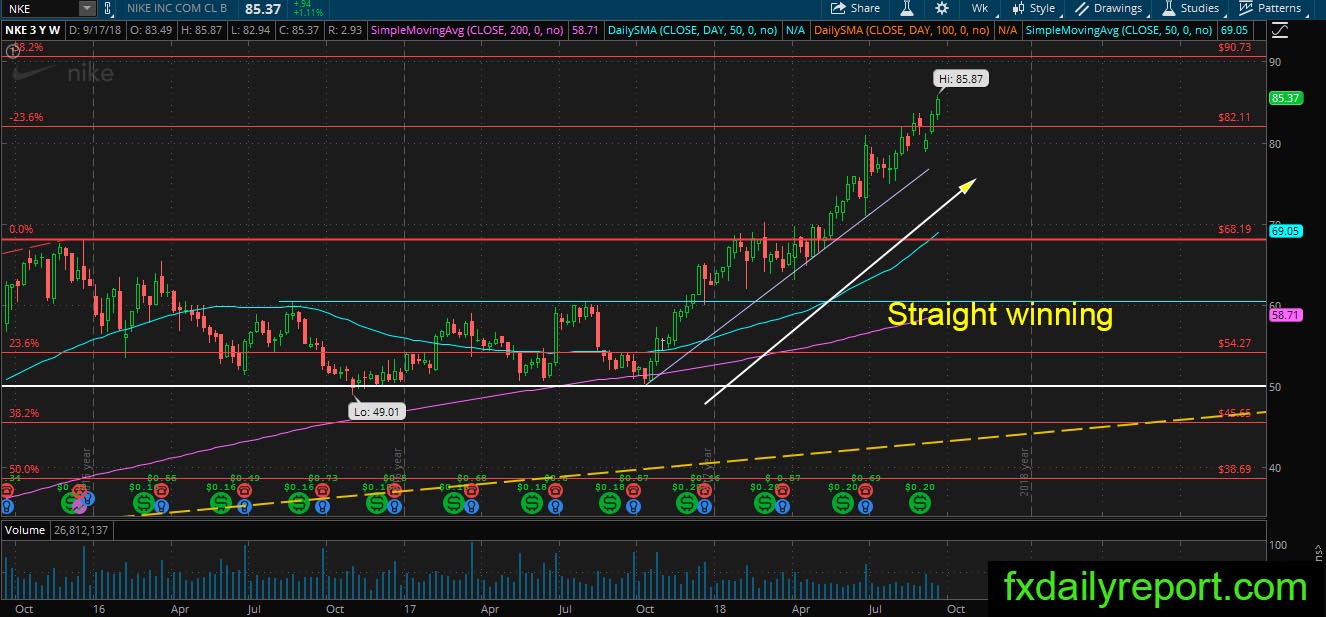
On the weekly chart, NKE has straight won without much trouble to reach the current level. The share prices also showing no sign of weakness yet and might reach 38.2% extension level at $90.73. At the current time, traders might have a hard time to take a long or short position. It is better to stay sideways for now.
Daily chart
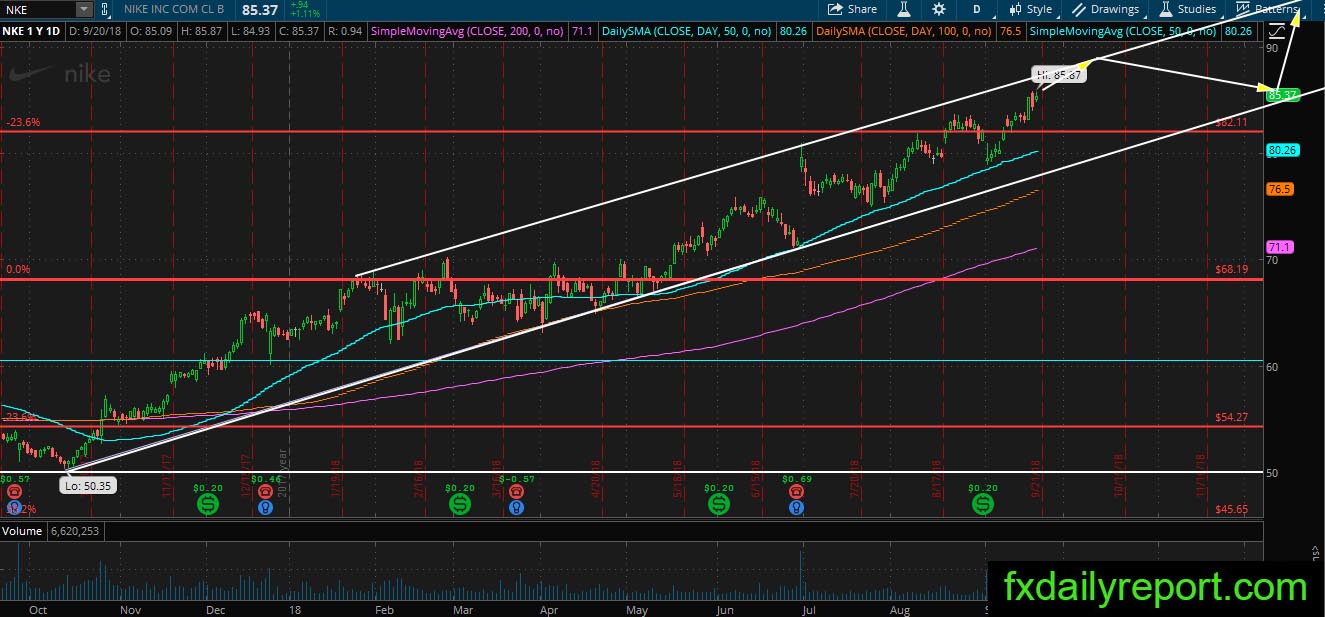
On the daily chart, we could see NKE moving inside the bullish channel and almost reach the top of the channel. Although it is a chance to enter a short position. We think a short position is a must to avoid as the bull still has strong domination. Traders might want to wait for a correction to happen and looking for long position only.
Trade plan
The long position could be taken when pullback happens. We favor $68.19 breakout point as the strong level to watch.
The bearish position is not suggested until the share prices printed strong bearish pattern on the monthly chart or reach 38.2% Fibonacci extension level.