
The NZD/USD currency pair on Wednesday pulled back off session highs of about 0.6169 to trade at about 0.6097 after US data. The currency pair also completed a downward breakout from a descending channel formation.
The pair has now fallen to trade below the 100-hour moving average line in the 60-minute chart. As a result, the currency pair has now dropped to trade in the oversold levels of the 14-hour RSI.
NZD/USD Fundamentals Overview

From a fundamental perspective, the NZD/USD currency pair is trading at the back of a relatively busy period in both markets. On Wednesday, the Reserve Bank of New Zealand (RBNZ) chose to keep the base interest rate unchanged at 5.5% for the fifth meeting in a row.
The RBNZ’s Governor Adrian Orr addressing the press conference following the February monetary policy said there are still concerns about underlying inflation while stating domestic price pressures are beginning to ease as expected.
In the US, durable goods orders for January missed the expected change of -4.5% with a change of -6.1%. Durable goods ex-transportation also fell short of the forecasted change of 0.2% with a change of -0.3%. On the other hand, nondefense capital goods orders for the period matched the expected change of 0.1%.
Elsewhere, the S&P/Case-Shiller Home Price Indices for December exceeded the (YoY) forecast of 6% with a change of 6.1%. The Housing price index for the period fell short of the forecasted (MoM) change of 0.3% with a change of 0.1%.
NZD/USD Technical Analysis (the 60-min Chart)

Technically, the NZD/USD currency pair appears to have recently completed a downward breakout from a descending channel formation. The 14-hour RSI also seems to support a short-term bearish bias as it moves closer to oversold conditions.
Therefore, the bears will be targeting extended declines at about 0.6058 or lower to 0.6025. On the other hand, the bulls will look to pounce on profits at about 0.6136 or higher at 0.6169.
NZD/USD Technical Analysis (the Daily Chart)
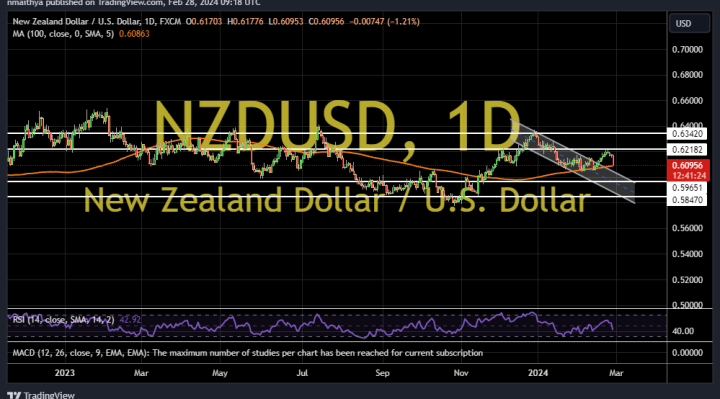
In the daily chart, the NZD/USD currency pair appears to have recently completed an upward breakout from a descending channel formation. However, the 14-day RSI has recently pulled back to avoid rallying into overbought conditions.
Therefore, the bears will be looking to extend the current pullback towards 0.5965 or lower to 0.5847. On the other hand, the bulls will be targeting long-term profits at about 0.6218 or higher at 0.6342.