
EBAY Long-term outlook

EBAY received downgrades from Jefferies and Well’s Fargo before the earnings report on 28th January. Both downgrades drive share prices lower. Well’s Fargo Brian Fitzgerald said the company share prices is a melting ice cube under tight competition with other e-commerce platforms.

In October the previous year, the company reported higher eps compared to analyst expectation and in-line revenue. However, the share prices gapped lower as the company projected lower forecast. EBAY project 4th quarter revenue at $2.77 – $2.82 billion, below the $2.85 billion consensus forecast. EPS expected to come out at 73 – 76 cents while the estimate sees 76 cents.
Will this January reports give the market upside surprise?
New Month
Monthly chart
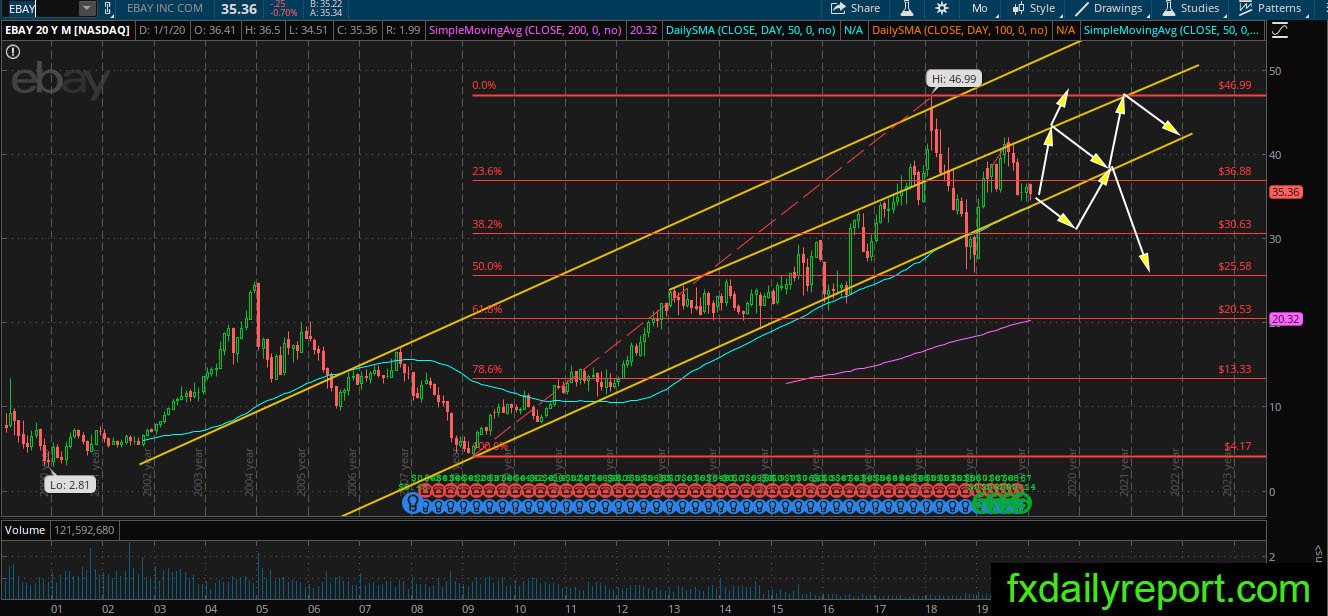
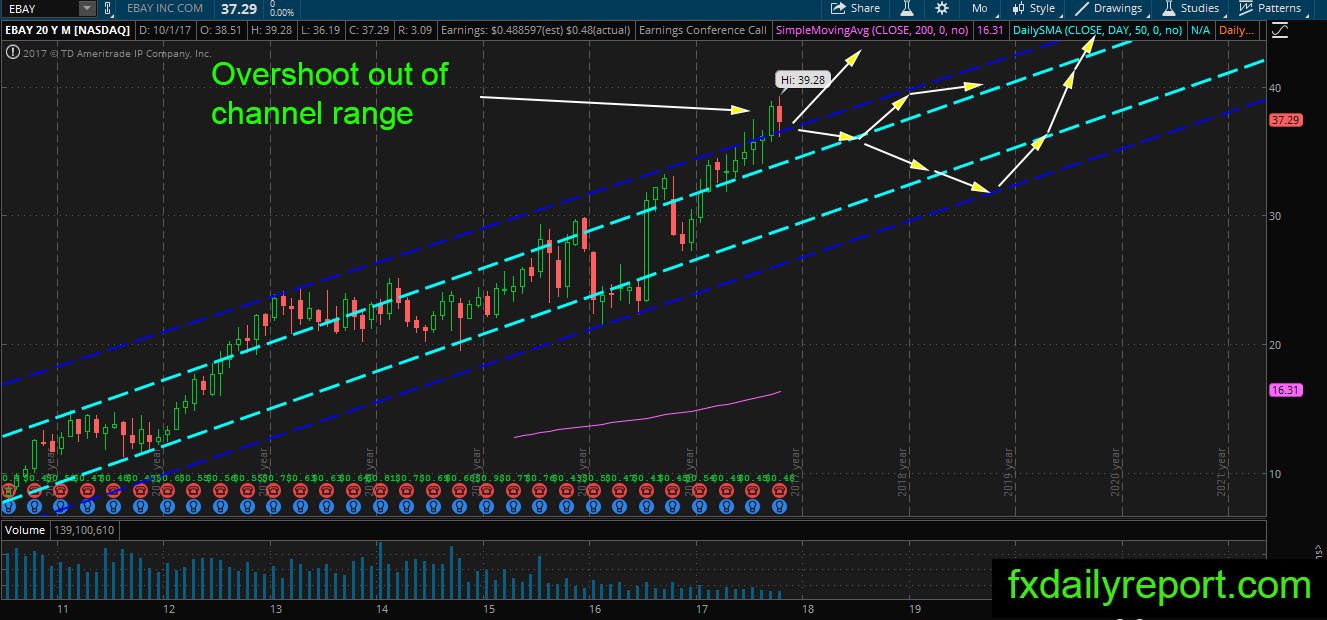
EBAY trend is bullish but the share prices have been rejected from the middle of the channel and currently testing the bottom of the channel. If the share prices could not bounce from the bottom of the channel and closed below 38.2% Fibonacci Retracement then we will expect a new bearish trend to form.
At the current time, traders could use the bottom of the channel as the level to look for long positions.
Weekly chart

It is an opportunity to enter long positions in EBAY share prices as it trades near the weekly SMA 200 and the bottom of the channel. However, if breakout and close below both support levels happen, traders might want to scale out and waiting for further reaction.
Daily chart
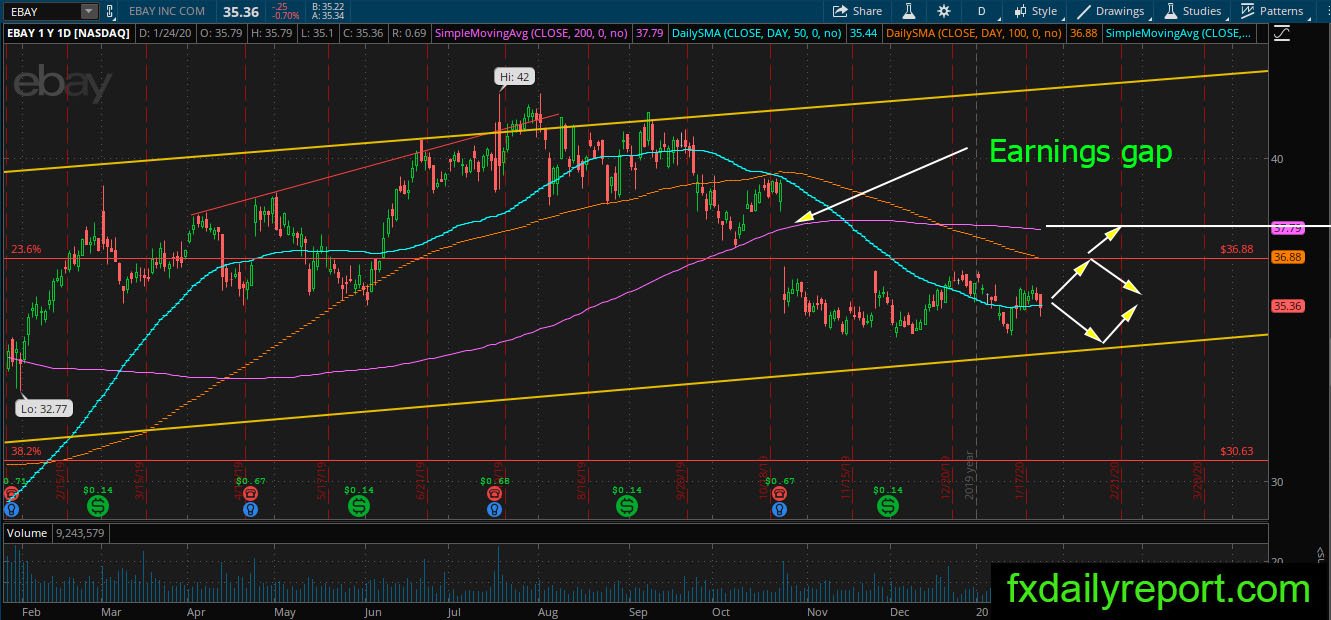
EBAY on the daily chart looks bearish as the share prices consolidate below the daily SMA 200. There is an earnings gap between $36.65 – $38.36 and it is possible the bull will close the gap. Traders might want to observe the share prices reaction near the daily SMA 100 and 200.
Trade plan
A long positions could be taken near the bottom of channel shown on the weekly and monthly chart.
A short positions could be taken near the daily SMA 100 and 200 when there are bearish reactions near both resistance levels.