
PG Long-term outlook

PG outperformed in January and February as the stock price reach new record high since December 2014. The price currently sits at $91.05, just shy $2.84 from $93.89 record high.

Despite series of downgrades in December and January, stock price proves the awarded downgrade is wrong and irrelevant to the company future share prices. Jim Cramer mad money told the market do not be a fool betting against the bull. Even though PG P/E amazingly overprice at 26.35 and the market ready for a correction, it is always a bad idea to go against the flow.
New Month
Monthly chart
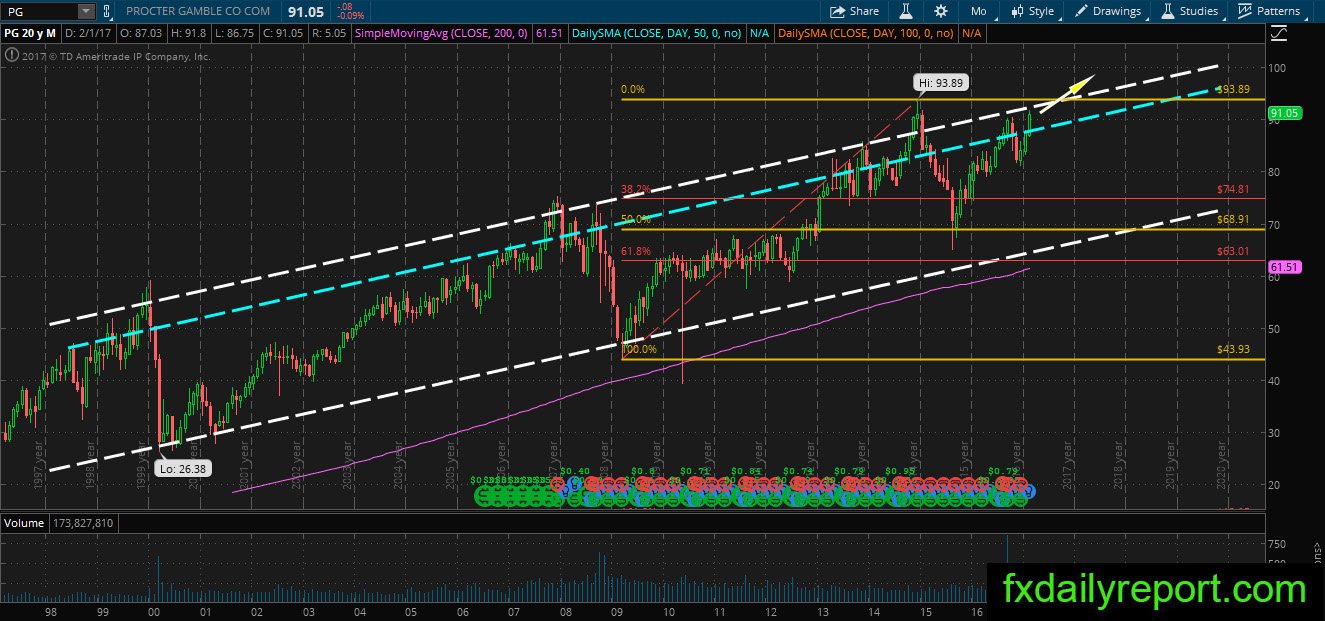
Three bullish candlesticks in the monthly chart show the strength of bullish trend in PG. The upward movement looks will continue in coming months and print a new record high above 2014 high $93.89. However, a rejection from the top of the white channel also possible, if the rejection happens, traders will see the price fall and search for support at blue channel.
Weekly chart
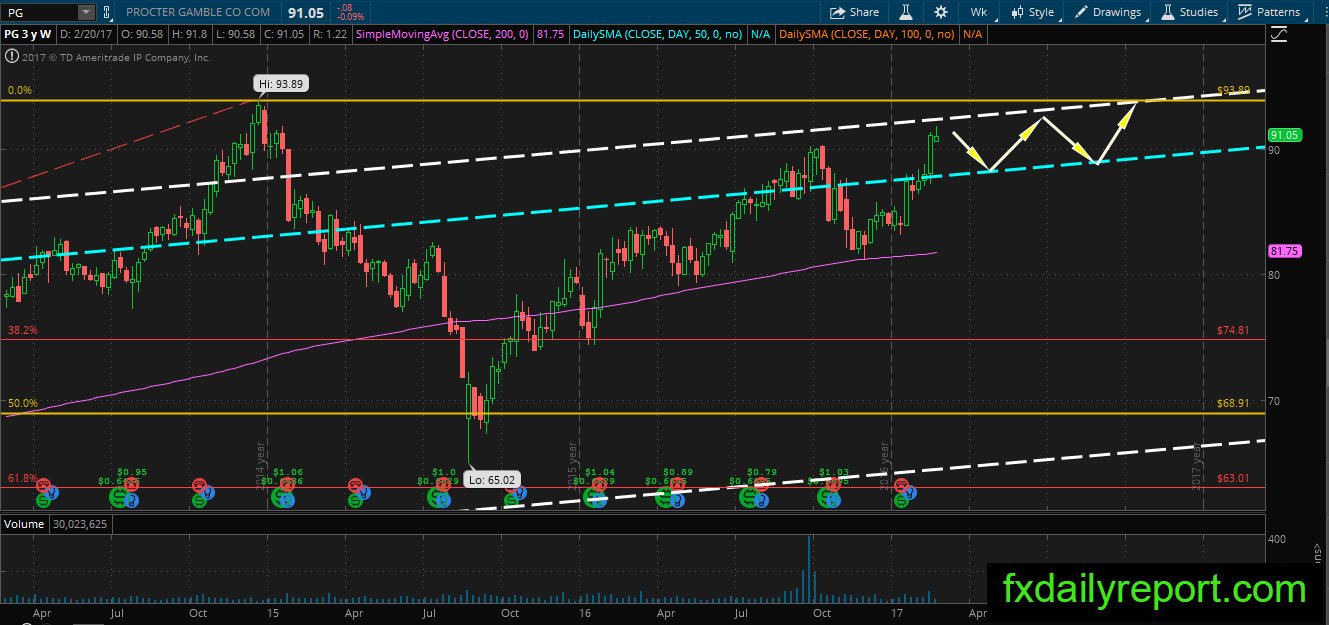
The bounce from WSMA 200 put the price near the top of the white channel, and it looks like the price will continue its movement between the top of the white and blue channel.
Daily chart
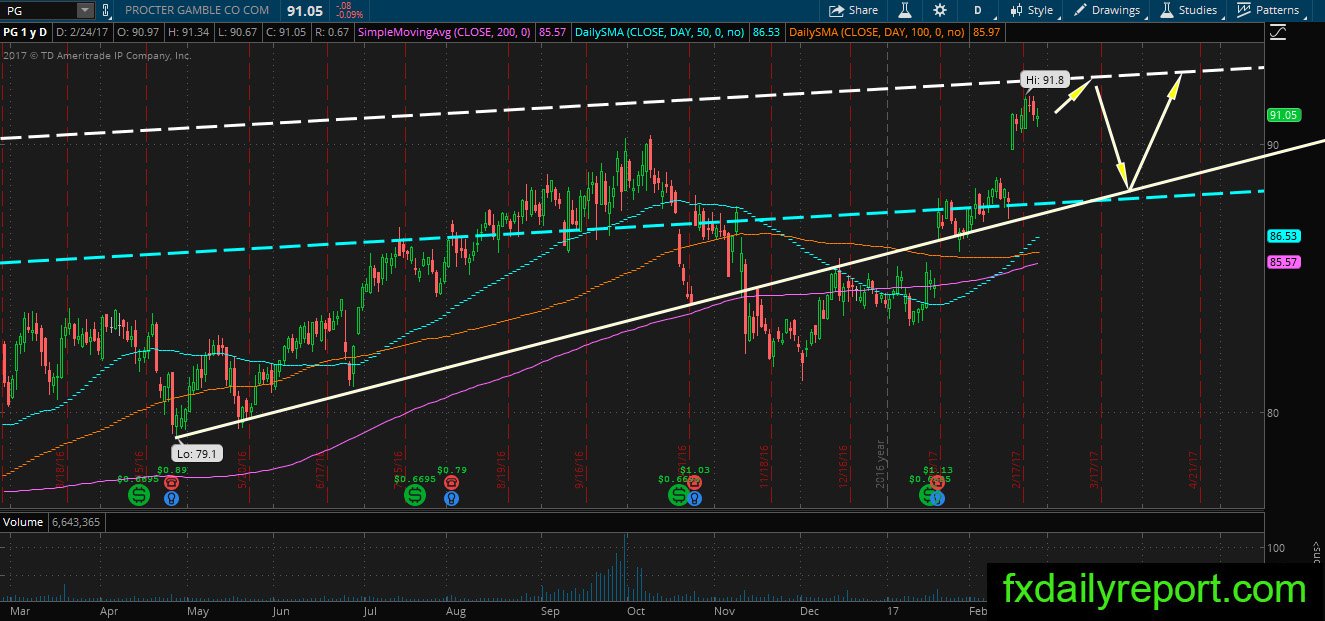
The trend of PG in daily chart is bullish, and recent gap put the price closer to the top of the white channel. Unfortunately, most of the gap usually closed, but traders could look for a long opportunity if it happens.
Trade plan
Bullish traders could look for long position between $88 – $89 or the close of the daily gap.
A short position could be taken when the price reached the top of the white channel.