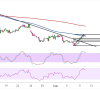
Natural Gas (NATGAS/USD) Price Technical Analysis for August 11, 2026
Natural gas appears to be staging a reversal after breaking above the descending trend line that had been capping its slide since early August.

Natural gas appears to be staging a reversal after breaking above the descending trend line that had been capping its slide since early August.
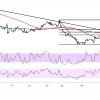
Natural gas broke down sharply from the late-July swing high near $3.00, slicing through a rising trend line and its short-term moving averages to confirm a resumption of the broader downtrend.
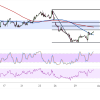
Natural gas broke down sharply from the $2.989 swing high late last month, slicing through a rising trend line that had connected the July lows…
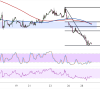
Natural gas broke down from its short-term consolidation range, slicing through a descending trend line connecting recent swing highs to confirm that a bearish reversal is underway.
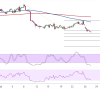
Natural gas has broken down from the range it had been consolidating in for most of July, as sellers finally overpowered the support that had been propping up price near the $2.80 to $2.99 region.
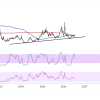
Natural gas is testing a critical long-term ascending trend line on the weekly chart, one that has connected a series of higher lows since the 2023 bottom.
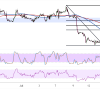
Natural gas broke down sharply from the consolidation zone it had been carving out for most of the past few weeks, plunging straight through the $3.05-$3.15 support area and confirming that sellers had wrestled control from the range-bound action.
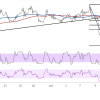
Natural gas broke down from its recent consolidation range, slicing through the $3.108 support level and rising trend line, confirming a shift in trend to the downside.