
U.S dollar index long-term technical analysis
Lower growth or slowdown in the economic growth incite fear in the market. Traders and investors presented by a sharp decline in China export, dovish outlook by the Fed, ECB reluctance to raise interest-rate. Aside from that, the inversion of bond rate-yield sends jitter to the market. Analysts projected a recession is coming.
All of the sentiment is bearish, but it is the opposite for the U.S dollar index. In March, the index climbed from 96.20 to close at 97.19. It might continue the upward movement in April as many major events will take place.

In April, the market will watch closely Brexit development, trade talk between U.S-China. The curtain might be raised and let the market know the next clue for the future currencies movement.
New Month
Monthly chart
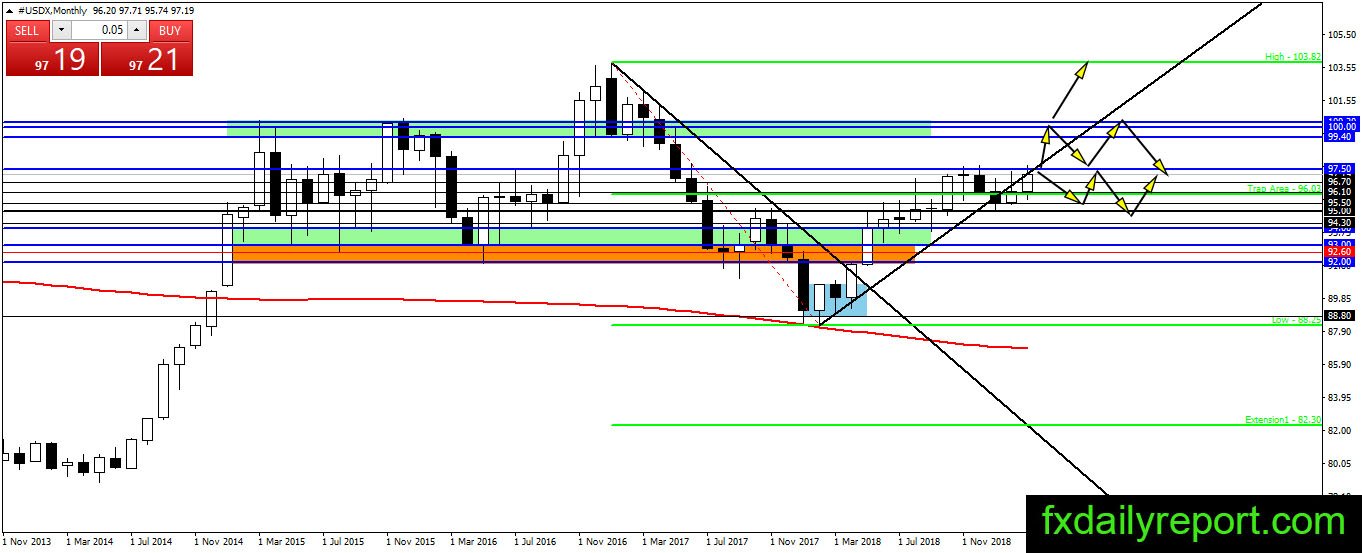
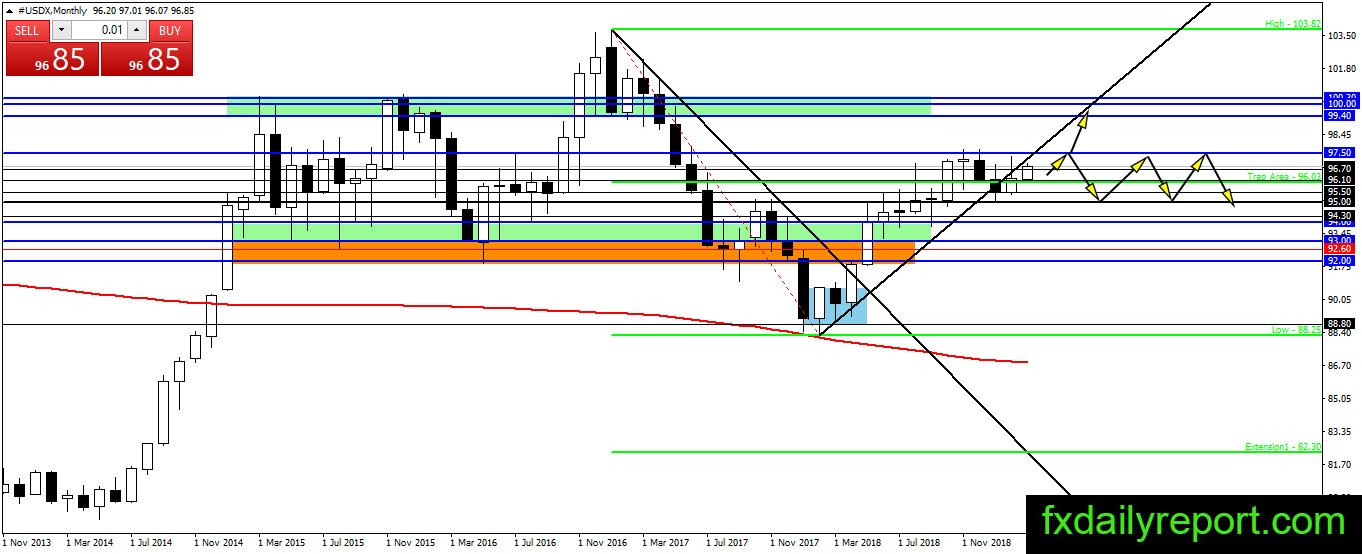
U.S dollar index closed the month on the high side and near 97.50 resistance. The index might be on the verge of upside breakout and it might happen in April. However, traders will follow current ranging outlook between 95.00 – 97.50 until actual breakout happen.
If the index could not close above 97.50 in April then we could assume the ranging movement will continue.
Weekly chart
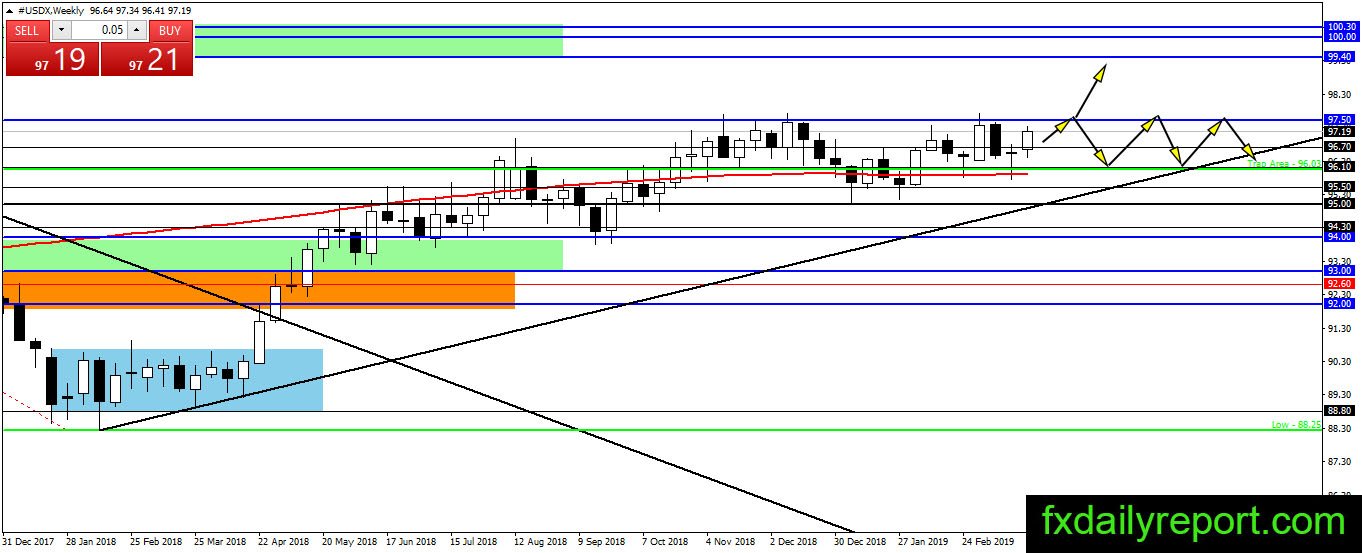
On the weekly chart, the index trapped between WSMA 200 and 97.50 resistance. The situation is similar to the outlook on the monthly chart. As long as there is no breakout above 97.50 then U.S dollar index expected to continue its ranging movement.
Daily chart
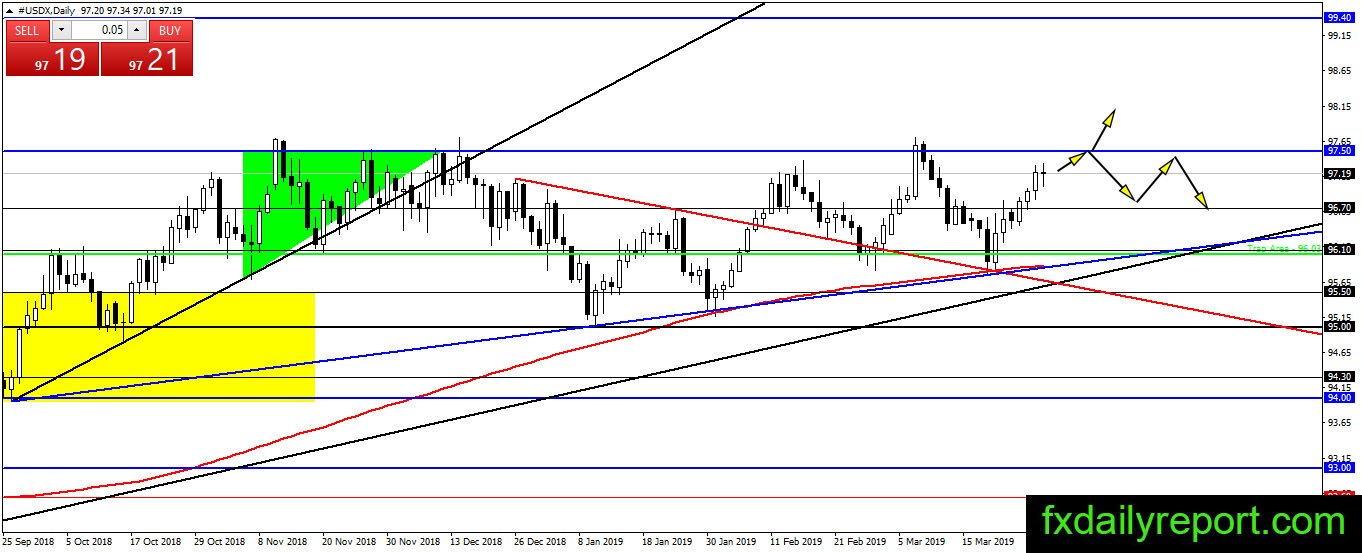
The bounce from SMA 200, trendline and the support 96.10 brought U.S dollar index to another bullish rally. It is getting near 97.50 and the test of the resistance in on the card. At the current time, it is better to observe the market reaction near 97.50 when the test happen.
Trade plan (For U.S dollar pair)
U.S dollar index look will continue its upward stride and reach 97.50 resistance. At the current time, it is better to continue holding U.S dollar long position and wait for the reaction near resistance. If there is a strong bearish pattern when the test happens, traders could enter U.S dollar short positions. (Same strategy)