
U.S dollar index long-term technical analysis
The situation of trade war between U.S and China is the main focus this month. Recently, President Trump postpones tariff implementation against China’s products which give the market a positive sign. We are getting near to a phase on a trade deal. Currently, the deal expected to happen in February next year.
U.S dollar index start to move lower this month and printed a lower low. If the index close lower this month below the previous month low then we will expect the start of a new bearish trend. On the other hand, a close above 97.50 followed by a bullish movement will help the index to maintain its bullish trend.
New Month
Monthly chart

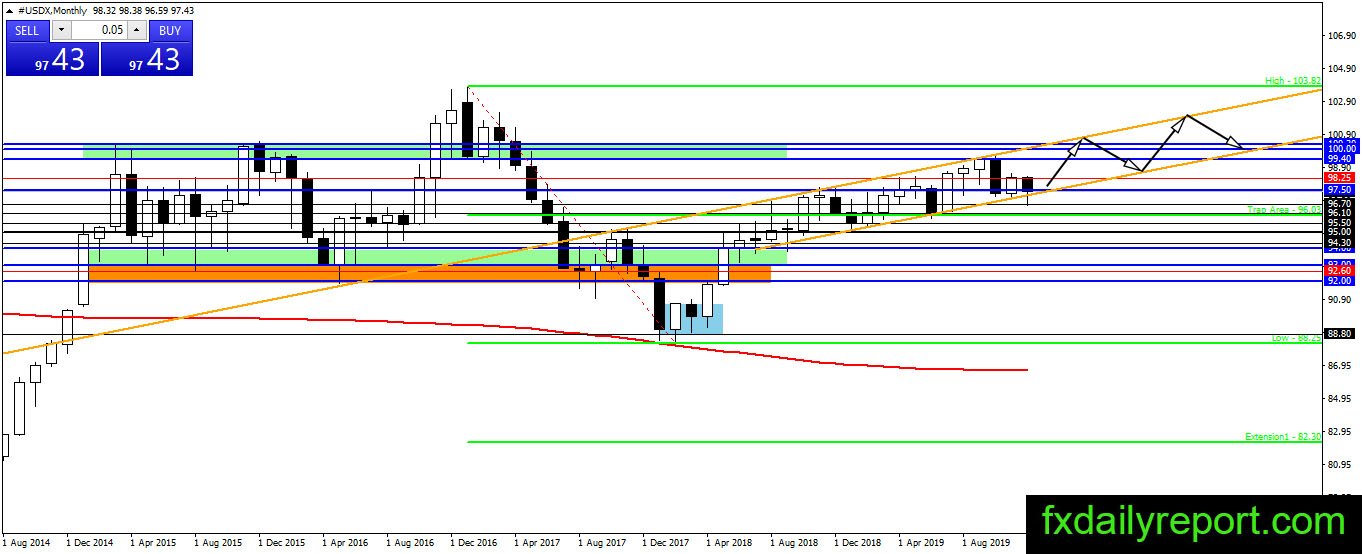
U.S dollar index might be under pressure this month but we have a reaction from the bottom of the channel and the index slowly move upward. If the index could close near its opening level by the end of the month then it might turn bullish next month. A close above 97.50 also a positive sign for the bull.
Weekly chart
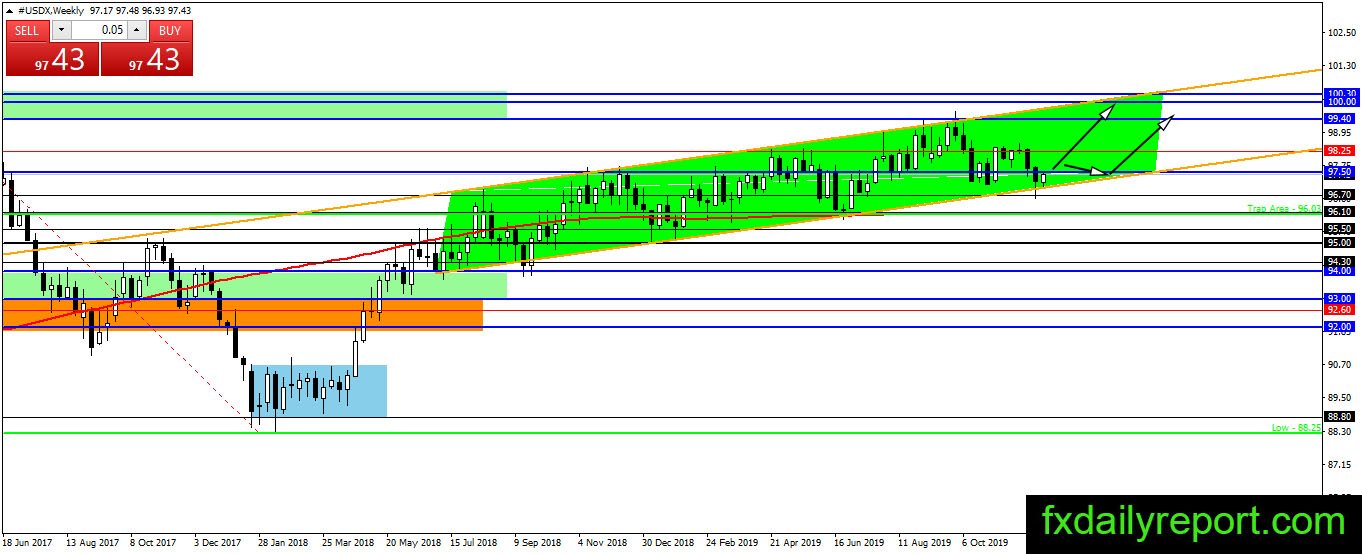
It is an important moment for the bull as the index stick near the bottom of the channel. This week, the index needs a close above 97.50 to continue its bullish bounce. As long as there is no close outside of the channel range then traders will expect the index to continue its movement inside the channel.
Daily chart
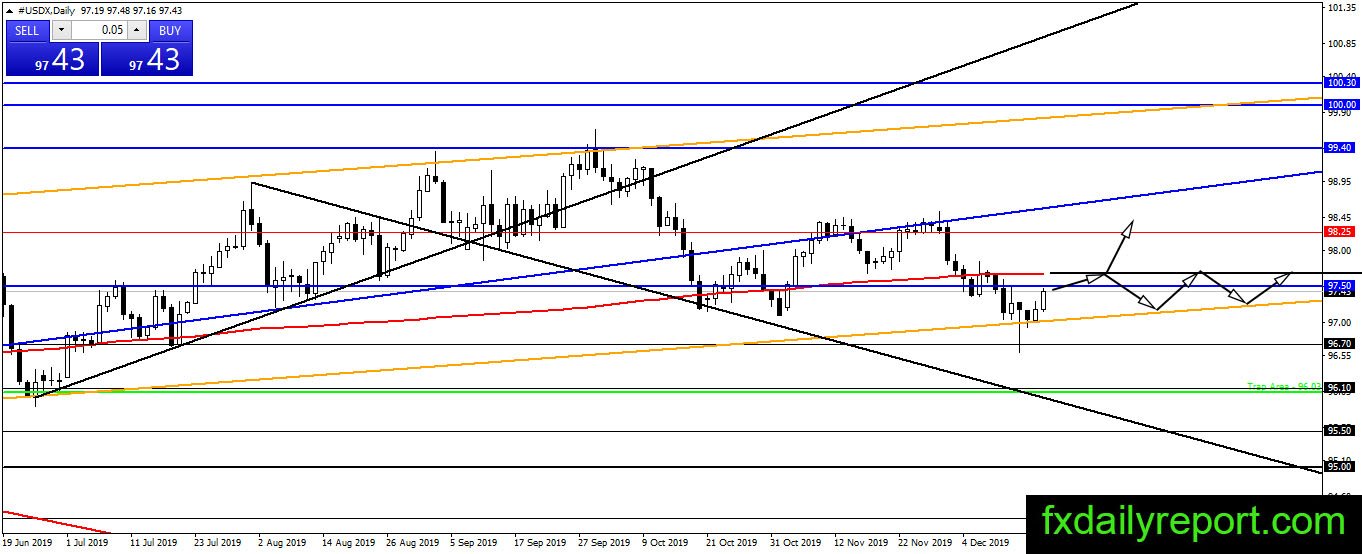
No close below the bullish channel and the index currently staging bounce from it. The bull needs a close above the daily SMA 200 and 97.50 resistance for further bullish confirmation. Traders will wait for the market reaction near both resistances level.
Trade plan (For U.S dollar pair)
November shows bullish close on the monthly chart above the 97.50 support level. The index has not shown any clue on the next direction yet. Traders should wait for the monthly closing level to determine the next direction. A bounce from the bottom of the channel on the monthly chart might be in progress. As long as no breakout and close below the channel then the index will continue bullish.