
U.S dollar index long-term technical analysis
A dovish stance by the Fed and a halt on trade war between U.S-China is the main driver of sentiment on the market right now. The pause of trade wars will extend to March, before the deadline, both U.S-China will need to reach an agreement or the trade war will continue. Aside from the news, China also cut key lending ratio by 1% to boost domestic growth.
U.S dollar index expected to continue under pressure in January and the following months until there is a new update from the Fed and trade war situation.
New Month
Monthly chart

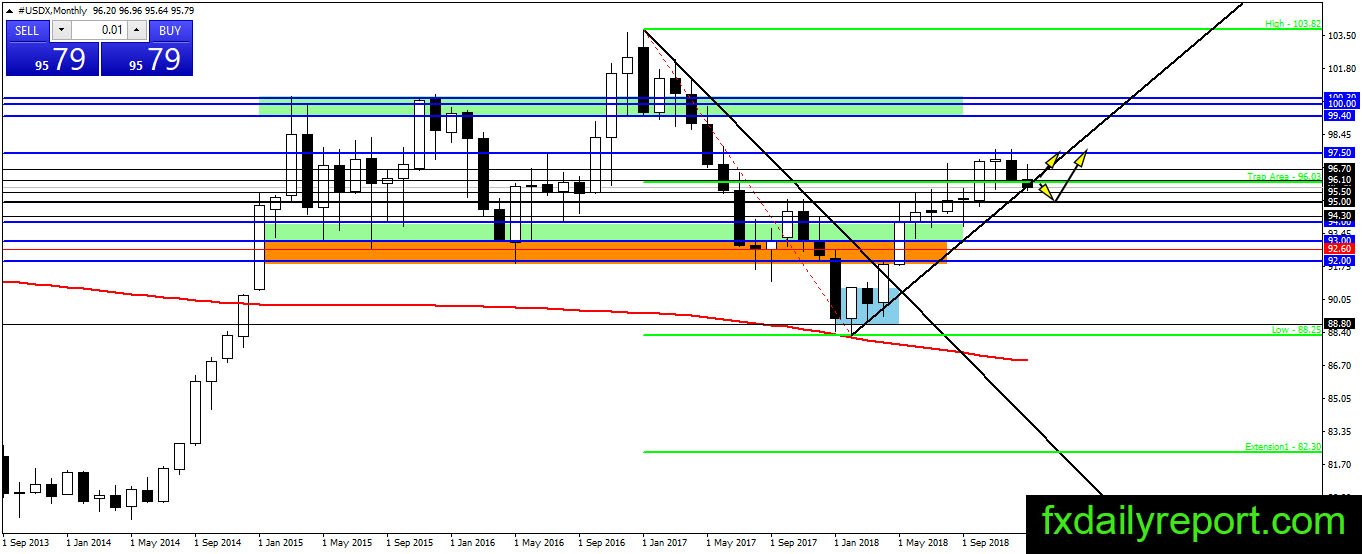
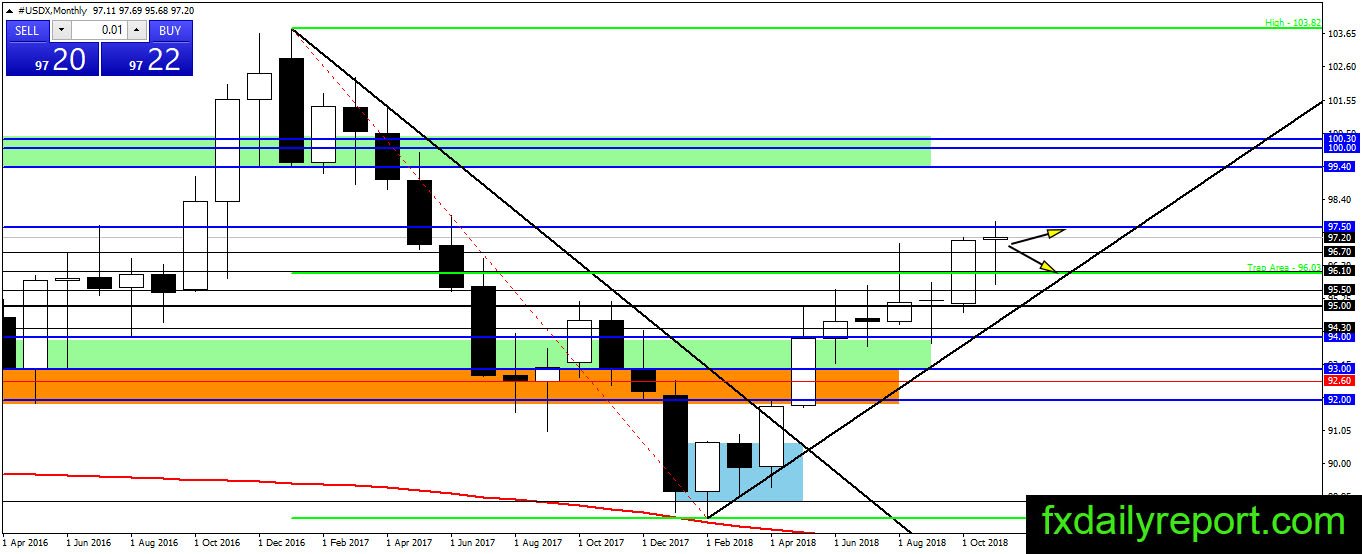
U.S dollar index rejected from 97.50 resistance and headed to the trendline. It is currently testing the trendline on the possible less rate-hike this year. We think the index has more chance to stay bullish than turn into a bearish trend. 95.00 is the key level to watch for a bounce.
A breakout below 95.00 will convince the market that the bullish trend might not continue and a test on 92.00 – 93.00 imminent.
Weekly chart
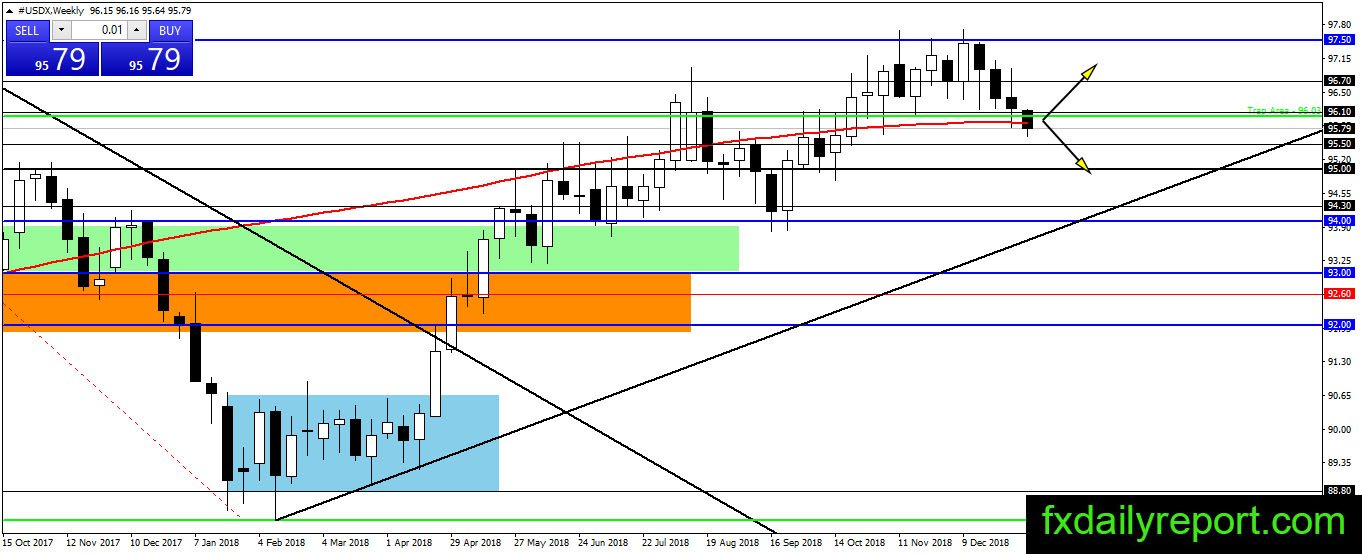
On the weekly chart, the index entered fourth bearish week and currently move down below the WSMA 200. Will the index closes below the averages and continue its bearish trend? Alternatively, will it close the week bullish and start a new rally to test 97.50 resistance?
Daily chart
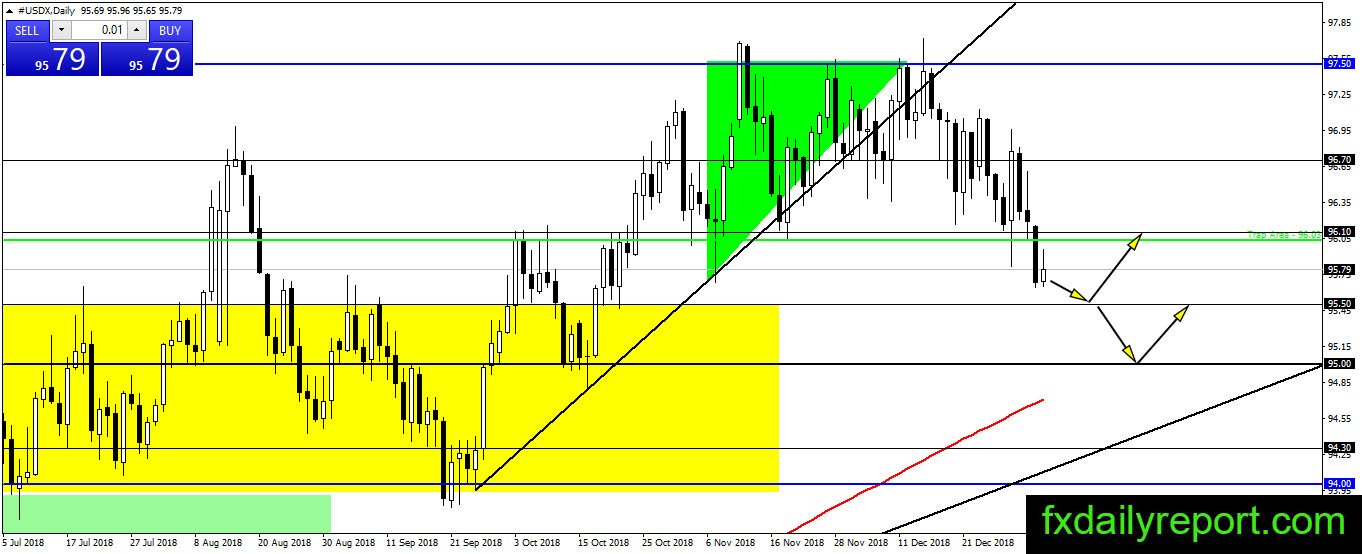
The outlook on the daily chart is bearish and the index looks will continue down to test 95.50 support level. If the bearish trend continues then we might see 95.00 reached in the medium term. Currently, traders might want to wait for sideways and prepare for position when 95.50 or 96.10 hit.
Trade plan (For U.S dollar pair)
Even though the U.S dollar index pulled back at the start of this year, the overall trend stays bullish. In this pullback, it might be the best time to look for an opportunity to enter long positions. Traders around the world are waiting for the development on The Fed decision whether to maintain the three rate-hike or start to sound dovish.