
U.S dollar index long-term technical analysis
The Fed grew dovish each month, told the market that they will not raise interest-rate and decide to monitor inflation. We are 10 years since the previous recession and next recession looms. The central bank is in dilemma, in the previous recession it could cut rates and do quantitative easings to combat the recession. But, in the future recession, it might enter the recession without any means to cut rates or do quantitative easings.
U.S dollar index is in a bullish trend and it might not change soon. Traders could continue to hold long positions in the U.S dollar for now.
New Month
Monthly chart

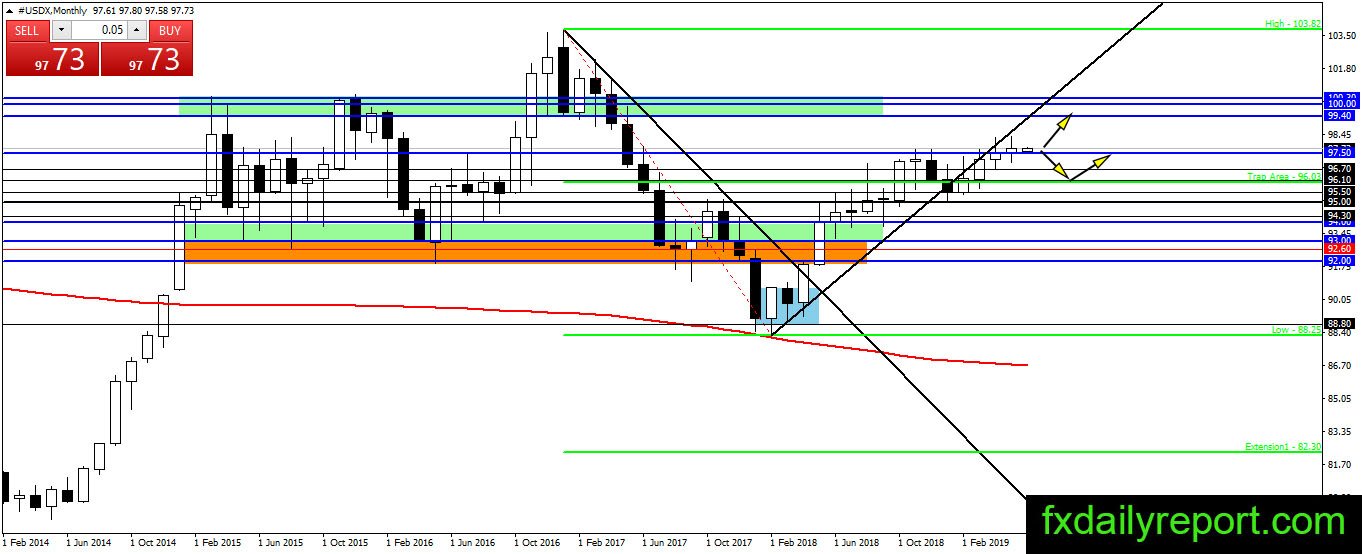
Another bullish close has been seen on the U.S dollar index, but the index losing upward momentum. The index move inside April range and closed inside it. Although the trend expected to continue bullish, it seems we will have the index stuck near 97.50 level for a while.
Weekly chart
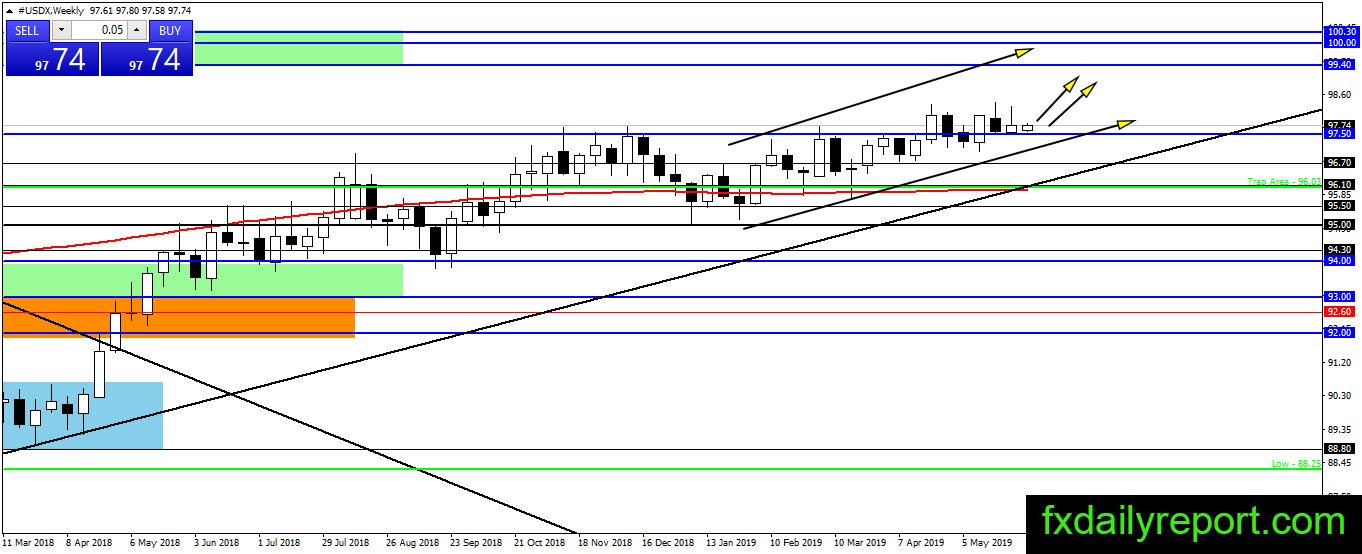
U.S dollar index flip-flopping at 97.50 signaling sideways trends and no change to the situation yet. The index might continue to stick near 97.50 until next direction settled. At the current time, traders could look for long positions and hope for a bounce from the support level. However, if a breakout below 97.50 happens, traders might want to consider closing long positions.
Daily chart
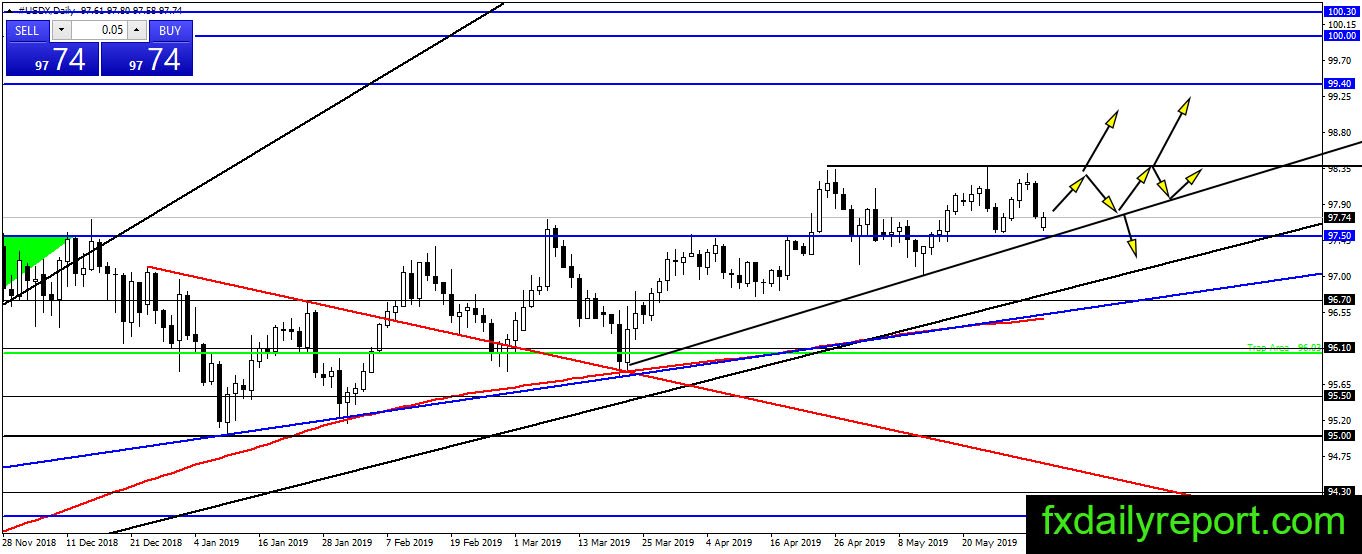
We have a triangle pattern on the U.S dollar index daily chart. The index currently supported near the bottom of the triangle and might start another rally toward the top of the triangle. Traders will wait for a breakout of the triangle pattern to determine the next direction.
Trade plan (For U.S dollar pair)
Wait until triangle consolidation on the index daily chart broken. Next direction forecast is to the long side and traders could make use the bottom of the triangle to enter long positions in U.S dollar. On the other side, a close below 97.50 could trigger selling and change the trend to bearish.