
The US Dollar Index on Friday extended the current weekly declines to a new 5-week low of about 98.68 after the latest round of US manufacturing data. The USDX has been trading within a descending channel since the start of the week amid a flurry of disappointing US economic numbers.
The dollar index has now fallen below the 100-hour and the 200-hour SMA lines in the 60-min chart. It has also moved closer to the oversold levels of the 14-hour RSI. This could trigger a temporary rebound.
The US Dollar Index Fundamentals Overview

From a fundamental perspective, the dollar index continues to experience significant levels of volatility amid mixed economic data. The latest earnings reports have also left investors with nothing much to chew on with some companies reducing their guidance for the year. Earlier in the week, the Dallas Fed Manufacturing Business Index for April edged lower to -73.7 down from -70 in the previous reading. The S&P/Case-Shiller Home Price Indices for Feb. beat the (YoY) expectation of 3.3% with 3.5%. Wholesale inventories also surprised with -1% versus an expectation of -0.1%.
On Wednesday, core personal consumption expenditures and Gross Domestic Price index outshone expectations. However, the annualized GDP for Q1 missed -4% with -4.8% while pending home sales came in-20.8% versus an expectation of -10%. Personal Income (MoM) and personal expenditure price index (YoY) for March missed expectations while continuing jobless claims were lower than expected. However, the initial claims for the week ending April 24, were a little higher than expected at 3.839M versus 3.5M. On Friday, the ISM Manufacturing Index and the Markit Manufacturing index came short of expectation. However, the general ISM Manufacturing PMI and Manufacturing Prices paid beat expectations.
The US Dollar Index Technical Analysis (the 60-min Chart)
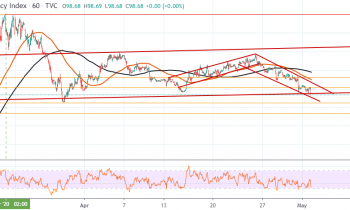
Technically, the US Dollar Index appears to be ex[eriencing a short-term bearish bias in the market sentiment. The DXY has bee trading within a sharply declining channel since the start of the week.
The bears will be targeting short-term profits at around 98.23 or lower at 97.67. On the other hand, the bulls will be looking for the next rebound with profit opportunities at 99.08 or higher at 99.61.
The US Dollar Index Technical Analysis (the Daily Chart)
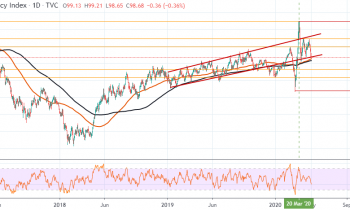
In the daily chart, the USDX appears to be pinned within an ascending channel. This indicates that the bulls still retain control of the market in the long-term. However, the recent rebound has pushed the pair closer to the trendline support. This could lead to a breakout or a short-term rebound.
The bulls will be targeting rebound profits at around 99.94 or higher at 103.00. On the other hand, the bears will be looking to pounce at around 97.32 or lower at 96.35.