
The US dollar index on Thursday bounced off the trendline support at 106.60 to retest the session highs of 106.90. The USDX appears to be trading within an ascending channel formation in the 60-min chart.
The dollar currency index has now rallied to trade several levels above the 100-hour moving average line. As a result, the DXY appears to be on the verge of entering the overbought levels of the 14-hour RSI.
The US Dollar Index Fundamentals Overview

From a fundamental perspective, the US dollar index is trading at the back of a relatively busy period in the market. On Thursday, the preliminary US gross domestic product for Q3 beat the annualised forecast of 4.2% with a change of 4.9%. The preliminary US gross domestic pride index for the period also outshone the estimated change of 2.5% with a change of 3.5%, while the preliminary core personal consumption expenditures for the quarter missed the (QoQ) expectation of 2.5% with a change of 2.4%. The initial jobless claims for last week fell short of the forecasted claim count of 208k with a tally of 210k.
Elsewhere, durable goods orders for September beat the expectation of 1.5% with a change of 4.7%. The durable goods orders ex-transportation also exceeded the estimate of 0.2% with a change of 0.5%, while nondefence capital goods orders beat 0.2% with a change of 0.6%. Pending home sales for September also outshone the estimate of -1.5% with a change of 1.1% (MoM).
The US Dollar Index Technical Analysis (the 60-min Chart)
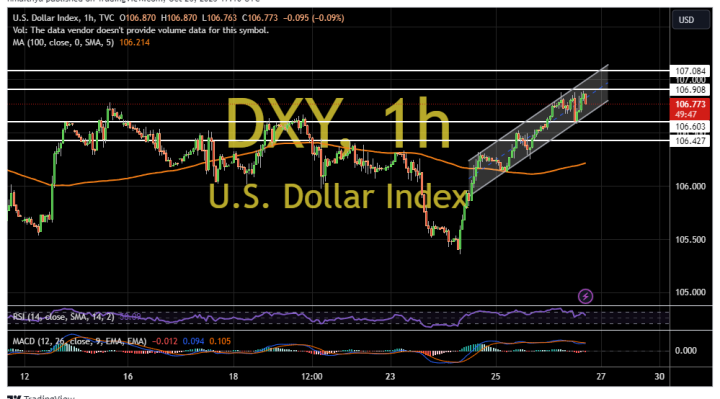
Technically, the US dollar index appears to be trading within an ascending channel formation in the 60-min chart. However, the hourly MACD appears to be struggling for momentum after completing an upward crossover.
Therefore, the bears will be targeting potential pullbacks at about 106.60 or lower at 106.42. On the other hand, the bulls will be targeting long-term profits at about 106.90 or higher at 107.08.
The US Dollar Index Technical Analysis (the Daily Chart)
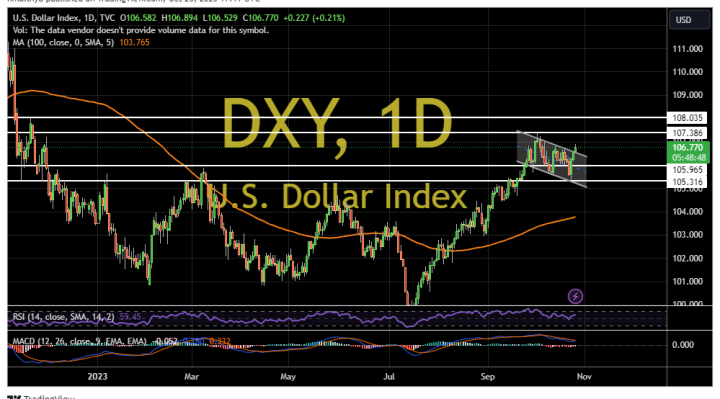
In the daily chart, the US dollar currency index appears to be about to complete an upward breakout from a descending channel formation. However, the daily MACD still supports a bear case after failing to complete an upward crossover.
Therefore, the bears will be targeting long-term profits at about 105.96 or lower at 105.31. On the other hand, the bulls will be targeting extended rebounds at about 107.38 or higher at 108.03.