
On Friday, the US dollar index bounced from the session lows of about 97.72 to trade at about 98.21 after the latest US data. The DXY trades within a descending channel formation in the 60-minute chart.
The dollar currency index continues to trade a few levels below the 100-hour moving average line, despite the rebound. As a result, the USDX still has some room left to run before reaching the overbought levels of the 14-hour RSI.
The US Dollar Index Fundamentals Overview

From a fundamental perspective, the US dollar currency index trades during a relatively busy period in the US market. On Friday, the US ISM Manufacturing PMI for April missed the expectation of 53, with a reading of 52.7. The ISM Manufacturing Employment Index also fell short of 49, with a reading of 46.4, while the ISM Manufacturing Prices Paid beat the forecast of 80, with a reading of 84.6.
On Thursday, the Chicago Purchasing Managers’ Index for April failed to match the forecasted reading of 53, with a reading of 49.2, down from 52.8. On the other hand, personal spending for March beat the expected (MoM) change of 0.3%, with a change of 0.6%, while personal spending matched the expectation of 0.9%.
Elsewhere, the preliminary annualized US gross domestic product for Q1 missed the expected change of 2.3%, with a change of 2%. The preliminary US gross domestic product price index for the quarter also fell short of 3.8%, with a change of 3.6%.
Elsewhere, the initial jobless claims for last week fell to 189k, down from 215k, beating the forecasted claim count of 215k. The Federal Reserve chose to keep the base interest rate unchanged at 3.75% as expected.
The US Dollar Index Technical Analysis (the 60-min Chart)
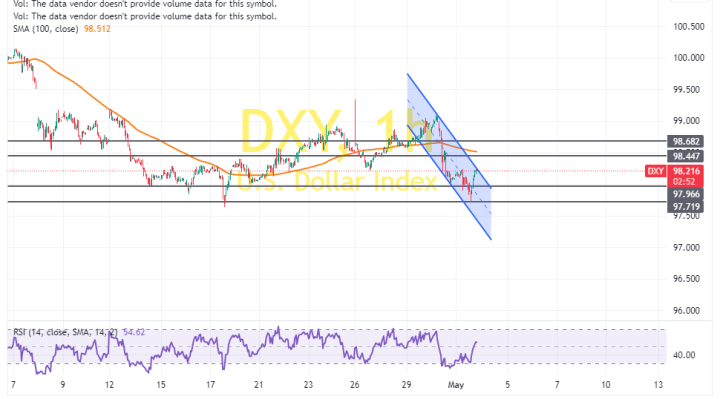
Technically, the US dollar index trades within a descending channel formation in the 60-minute chart. However, the 14-hour RSI has recently bounced back to avoid falling into oversold conditions.
Therefore, the bulls will look to extend the latest rebound towards 98.44 or higher to 98.68. On the other hand, the bears will look to pounce on pullbacks at about 97.96 or lower at 97.72.
The US Dollar Index Technical Analysis (the Daily Chart)
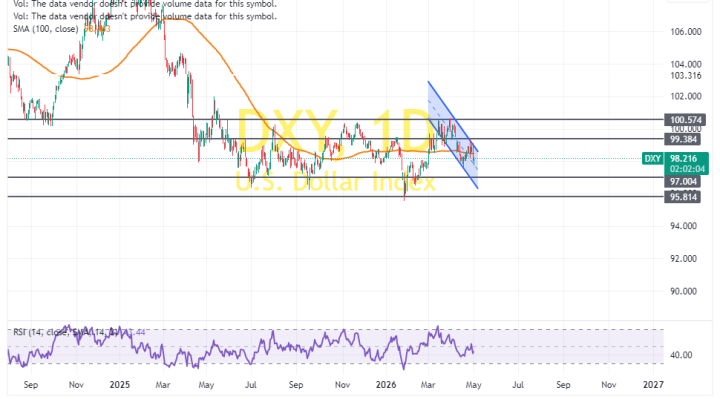
In the daily chart, the US dollar currency index also trades within a descending channel formation. However, the 14-day RSI still has room left to run before reaching oversold conditions.
Therefore, the bears will look to stretch the current run of declines toward 97.00 or lower to 95.81. On the other hand, the bulls will look to pounce on rebounds at about 99.38 or higher at 100.57.