
The US Dollar Index on Tuesday continued to trade within an ascending triangle formation in the 60-min chart. This followed Monday’s breakout from a sharply descending channel formation.
The US dollar currency index is now perched just above the 100-hour SMA while the 200-hour SMA is several levels below. It continues to trade closer to the overbought levels of the 14-hour RSI in the 60-min chart.
The US Dollar Index Fundamentals Overview

From a fundamental perspective, the USDX is trading at the back of significant development in the US economy. The government has signed a new stimulus package of $1.9 trillion dubbed the rescue plan. This is meant to help alleviate the challenging economic conditions created by the pandemic. The countdown to the signing of the stimulus package helped the DXY to rally at the start of the month. Nonetheless, coronavirus cases continue to rise in the country which paints an uncertain picture over how long the pandemic will continue to ravage global economies.
Based on the latest US data, the retail sales control group for February came short of the expected change of -0.9% with -3.5%. On the other hand, general retail sales the (MoM) change of -0.5% with a change of -3%. Elsewhere, retail sales ex-autos failed to match the expectation of -0.1% with the (MoM) change of -2.7%. Industrial production and capacity utilization also missed estimates while import and export price indexes outshone the (MoM) expectations.
The US Dollar Index Technical Analysis (the 60-min Chart)
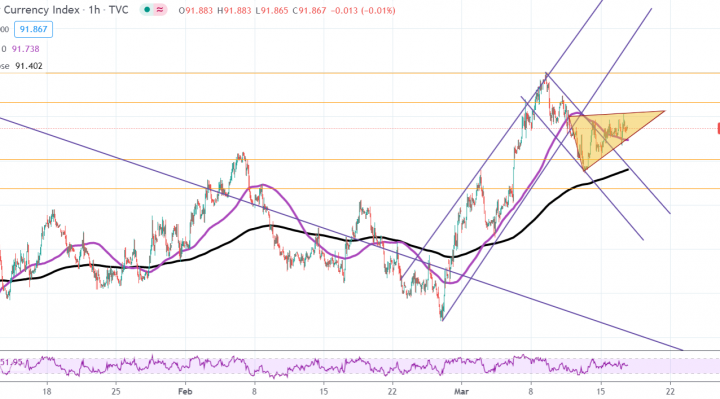
Technically, the USDX appears to be trading within a consolidative triangle formation in the 60-min chart. This comes off a sharply descending channel. It shows an attempt by the bulls to trigger a short-term reversal.
They will be targeting short-term profits at around 92.16 or higher at 92.49. On the other hand, the bears will look to pounce on pullback profits at around 91.51 or lower at 91.18.
The US Dollar Index Technical Analysis (the Daily Chart)
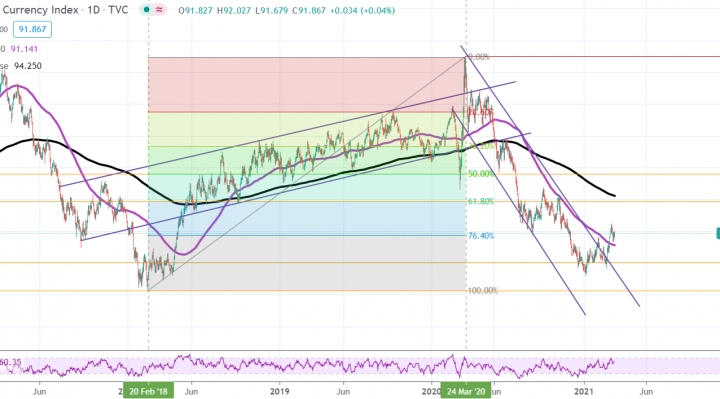
In the daily chart, the US Dollar Index appears to have recently made a bullish breakout from a sharply descending channel formation. This indicates an attempt by the bulls to take long-term control of the currency index.
They will target long-term profits at around 61.80% and 50% fib levels at 93.87 and 95.62, respectively. On the other hand, the bears will look to pounce for profits at around 90.02 or lower at the 100% fib level at 88.24.