
The US Dollar Index (DXY) has bee trading in a consolidative sideways movement over the last three days between 97.30 and 97.70. This trend comes following a major plunge that occurred at the start of the month when the USDX plunged from a new multi-year high of about 98.90 to bottom at around 97.24.
The US Dollar Index appears to be eyeing another rebound but so far the 97.70 level is providing strong resistance while 97.20 continues to prevent any more downward movements.
The US Dollar Index (DXY) Fundamentals Overview

From a fundamental perspective, the US Dollar Index (DXY) is trading at the back of a major week in the US. The plunge at the start of the month can be explained by last week’s 25 basis points rate cut coupled by an escalating trade war with China.
Trump’s decision to impose 10% trade tariffs on Chinese products worth $300 billion has created increased uncertainty in the market, which triggered a rise in volatility. Furthermore, this week’s economic data has failed to trigger a highly expected rebound, which is why the DXY appears to be consolidating in a sideways movement.
The nonfarm payrolls were in line with expectations last week while earlier this week, the Markit PMI data for Services and Composite PMI beat expectations.
The US Dollar Index (DXY) Technical Analysis (the 60-min Chart)
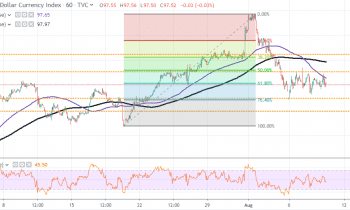
Technically, the USDX is trading within the normal trading zone in the Relative Strength Index Indicator. This suggests that the current pattern could continue through next week.
Using the Fibonacci Retracements as illustrated in the 60-min chart, the US Dollar Index (DXY) is currently pegged just around the 61.80% Fib level. This creates interesting opportunities for the bulls around 50% Fib level at 97.77 while the bears will target 76.40% Fib level at 97.24.
The US Dollar Index (DXY) Technical Analysis (the Daily Chart)

In the daily chart, the USDX appears to be trading within bullish widening wedge after the June 25, reversal. It recently bounced off the support trendline but that rebound did not materialize due to intense selling pressure since the start of the month.
As per the Fibonacci Retracements in the daily chart, the bulls will target long-term profits at around 23.60% Fib level at 98.20 while the bears will be looking at the 61.80% Fib level at 96.98 to strike.
In summary, while the reversal pattern since June 25th seems to suggest that the USDX is experiencing a bullish bias, the short-term selling pressure gives control to the bears.