
The US Dollar Index (DXY) on Thursday extended the current weekly loses to 98.09 before making a tepid rebound to end the session at around 98.39. The USDX had extended last week’s gains on Monday to new multi-year highs of 97.37 before pulling back on Tuesday.
The DXY is now trading just below the 50% Fib level after the decline from the most recent rally approached the 76.40% on Thursday. The relative Strength Index Indicator in the 60-min chart shows that there is still some space down below following the late attempt to recover, which means that the downward movement could still continue.
The US Dollar Index (DXY) Fundamentals Overview

From a fundamental perspective, the USDX is trading at the back of a calmer period in the US financial markets. Last week was not as stormy as the previous three when the Federal Reserve cut interest rates, Trump announced trade tariffs on Chinse goods and then a week later China retaliated.
However, from an economic standpoint, it is still a mixed basket judging by this week’s latest round of economic data. On Monday was a Federal Holiday, so no activity. On Tuesday, the ISM Manufacturing PMI for August missed the expectation of 51.0 with 49.1, a significant drop from the previous month’s figure of 51.1 points. Yesterday, US trade Balance came in at -$54.0 billion versus an expectation of -$53.5.
And today, Thursday, nonfarm productivity beat the expectation of 2.2% change with 2.3% change for Q2 while unit labor costs for the same period edged higher 2.6%, better than the predicted increment of 2.5%.
The US Dollar Index (DXY) Technical Analysis (the 60-min Chart)
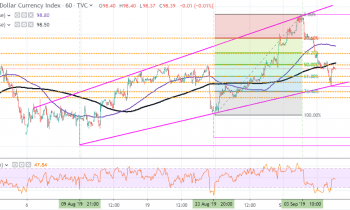
Technically, the US Dollar Index (DXY) appears to be trading in a highly volatile bullish wedge. The USDX recently bounced off the current support trendline at 98.09 and this rebound has created some interesting trading opportunities as demonstrated using the Fibonacci Retracements.
The bulls will be targeting short-term profits at around 50% Fib level (98.45), 38.20% Fib level (98.67) and 23.60% Fib level (98.94). On the other hand, the bears will look to pounce by targeting profits at around 61.80% Fib level (98.26), 98.15 or lower at 76.40% Fib level (97.98).
The US Dollar Index (DXY) Technical Analysis (the Daily Chart)
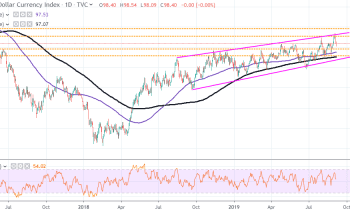
In the daily chart, the bulls still appear to be in control as the DXY continues to trade ina slightly upward trending channel. The USDX has recently bounced off the trendline resistance at around 99.12, which triggered this week’s plunge.
In the RSI indicator, the downward movement appears set to continue since the US Dollar Index is far from hitting the oversold levels. Therefore, the bears will target long-term profits at around 97.18 while the bulls will hope for an immediate rebound back up towards 99.37 or higher at 99.85.
In summary, the US Dollar Index (DXY) appears to be trading under modest bullish pressure in the long-term while the bears fight to take control in the short-term.