
The US Dollar Index (DXY) pulled down on Friday to trade at around 97.70. The US Dollar currency index measures the performance of the greenback against a basket of six major currencies and a move downwards indicates that it has weakened against its rivals.
The latest pullback comes barely a day after the USDX rallied to trade at 98.27 on Thursday, which is one of the highest levels reached this year. The DXY appears to be finding strong resistance around the 98.30 level while support can be located at around 97.50 level.
The US Dollar Index (DXY) Fundamentals Overview

Following President Trump’s latest tweet about levying Mexican products entering the US a tariff of 5%, the US 10-Year Treasury Yield tumbled to hit a new 20-month low of 2.16%. In return, the market reacted negatively to this movement with major indices shading points.
The US Dollar Index was not spared as it dropped from its weekly high of about 98.27 to trade at about 97.79 late in the afternoon.
Going into next week, traders will be looking forward to the US non-farm payrolls with the Jobs data providing a basis for the USDX’s next move.
The US Dollar Index (DXY) Technical Analysis (the 240-min Chart)
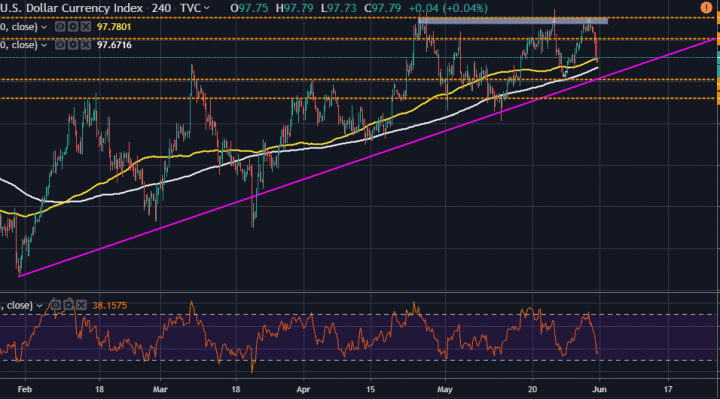
Technically, the US Dollar Index appears to be trading within an upward trending channel, which has recently started to form a flat top. This suggests a potential case of short-term consolidation, which could trigger a breakout.
As such the bulls will target profits at around 98.27 level, the most recent high while the bears will hope that the pullback continues toward the 97.53 level, the previous rebound point.
US Dolla Index (DXY) Technical Analysis (the Daily Chart)
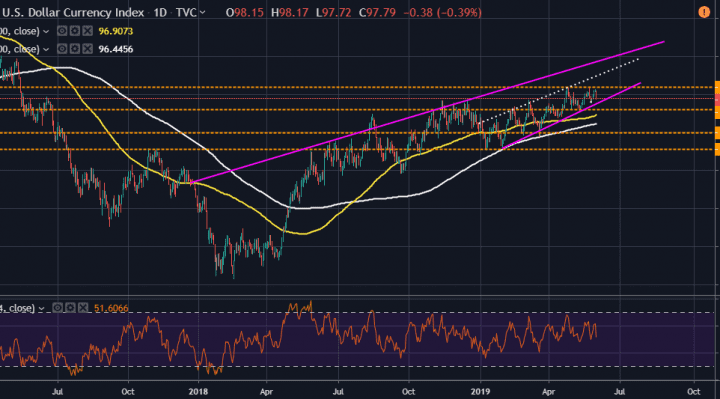
In the daily chart, the USDX appears to be on an ascending wedge but has recently dropped towards the base of the trendline support.
Both the 100-day and the 200-day moving average lines are right below this new wedge formation, which suggests that the US Dollar Index still enjoys a strong bullish bias. This creates multiple trading opportunities for both the bulls and the bears to target as illustrated in the chart above.
In summary, USDX traders will be looking forward to next week’s economic data to provide some direction as we begin the new month. However, Trump’s latest tweets will continue to put pressure on the DXY until then.