
The US dollar index on Friday extended the current mid-week rally towards 90.20 following the latest round of US data. The USDX has since made a bullish breakout from a descending channel formation in the 60-min chart.
The DXY is now trading within a smaller ascending channel. It has surged above the 200-hour SMA while the 100-hour SMA is more levels below. The dollar index is also trading closer to overbought levels of the 14-hour RSI.
The US Dollar Index Fundamentals Overview

From a fundamental perspective, the US Dollar currency index is trading at the back of a relatively busy period in the US market. On Friday, the US jobs data for December missed the expected job count of 71k new jobs. Instead, it posted 140k job losses. The average hourly wage for the month increased by 5.1% on a (YoY) basis compared to the expected growth of 4.4%. On the other hand, the unemployment rate of 6.7% remained unchanged from November, beating the expectation of 6.8%.
Earlier in the week, the ISM Services PMI for December beat the expectation of 54.6 with 57.2. The ISM Services New Order Index beat 54.9 with 58.5 while the Prices Paid and Employment index both missed estimates. The ISM Manufacturing PMI outperformed 56.6 with 60.7. The ISM Manufacturing Employment Index and Prices Paid also outshone estimates while the New Orders Index failed to match expectations.
Elsewhere, the ADP Employment change for December missed the expectation of 88k jobs after posting 123k job losses. The initial and continuing jobless claims outperformed estimates.
The US Dollar Index Technical Analysis (the 60-min Chart)
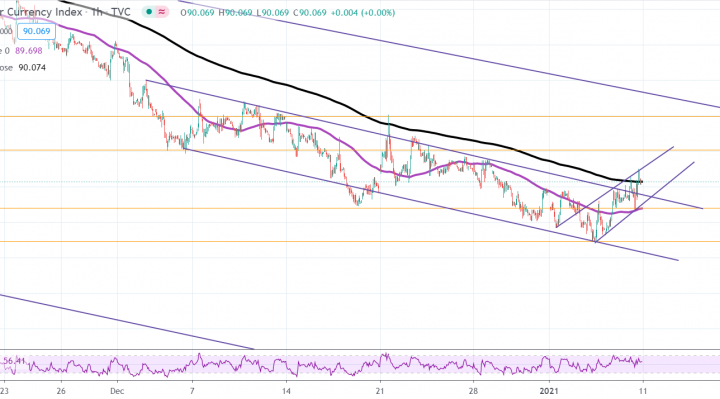
Technically, the USDX appears to be trading within an ascending channel formation in the 60-min chart. This comes after a breakout from the descending channel formation.
The bulls will be looking to ride the current reversal by targeting profits at around 90.52 or higher at 90.99. On the other hand, the bears will look to pounce for pullbacks at around 89.70 or lower at 89.22.
The US Dollar Index Technical Analysis (the Daily Chart)
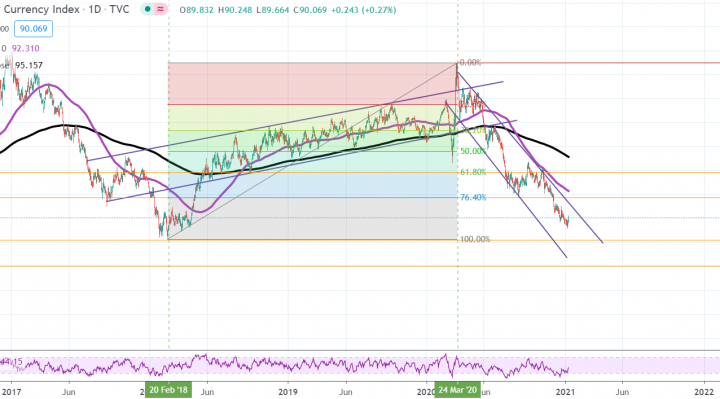
In the daily chart, the DXY appears to be trading within a sharply descending channel formation. This indicates a strong long-term bearish bias in the market sentiment. The recent rebound pushed the USDX off oversold levels back to the normal trading zone of the 14-day RSI.
The bulls will target long-term profits at around 76.40% and 61.80% fib levels at 91.75 and 93.85, respectively. On the other hand, the bears will look to profit at around the 100% fib level at 88.22 or lower at 86.04.