
The US Dollar Index (DXY) on Thursday extended the current weekly gains to top 100.35 before pulling back late on to settle at 100.10. The US benchmark currency index has been on an upward movement since late last week. This comes after it bottomed around the 98.37 level following a 5-day plunge.
The dollar index has on Thursday ventured to overbought levels of the 60-min RSI before the late pullback pushed it back to the normal trading zone. The USDX is now pegged at the current level of the 200-hour SMA while the 100-hour SMA is several pips below.
The US Dollar Index Fundamentals Overview

This week’s rebound in the US dollar index has been driven by a positive ISM Manufacturing PMI, which beat the expectations of 45 with 49.1. Earlier in the week, the ADP employment change also impressed with 152k compared to an expectation of 27k. The ISM Manufacturing Employment Index also outshone 43.6 with 43.8. Pending Homes Sales for February also beat the expected (MoM) change of -1% with 2.4% while the Chicago Purchasing Managers Index for March came in at 47.8 versus 40.
However, the initial jobless claims for the week ending March 27 disappointed with a massive figure of 6.648M versus an expectation of 3.5M. The Dallas Fed Manufacturing Index also plunged to -70 compared to an expectation of 6.2. The Markit Manufacturing PMI for March disappointed with 48.5 versus 49.2. The ISM Manufacturing Prices Paid and New Orders Index also failed to match the expectations.
On Friday, investors will be looking forward to the March non-farm payrolls, average wage growth, and the unemployment rate.
The US Dollar Index Technical Analysis (the 60-min Chart)
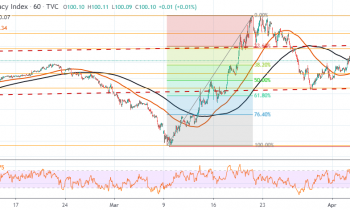
Technically, the US Dollar Index appears to be experiencing a short-term bullish bias in the market sentiment. This comes hot n the heels of a major plunge, which came at the back of a significant run between March 9 and March 20.
The bulls will be targeting short-term profits at around 23.60% fib level at 100.88 or higher at 101.84. On the other hand, the bears will look to pounce at around 99.31 or lower at 98.37.
The US Dollar Index Technical Analysis (the Daily Chart)
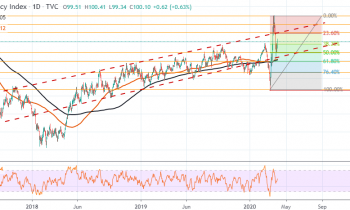
In the daily chart, the US Dollar index appears to have recently pulled back off a highly volatile surge. This pullback has pushed the USDX back to trade within an ascending channel. This shows that the bulls are still in control.
They will be targeting long-term profits at around 23.60% Fib level at 101.99 or higher at 102.94. On the other hand, the bears will look to target profits at around 50%, 61.80% and 76.40% Fib levels at 98.88, 97.86, and 96.62.