
The US dollar index on Thursday pulled back off session highs of about 102.830 to trade at about 102.489 following the latest round of data. The DXY appears to be trading within a descending channel formation in the 60-min chart.
The dollar currency index continues to trade above the 100-hour moving average line despite the pullback. As a result, the USDX appears to have more room left to run before reaching oversold levels of the 14-hour RSI.
The US Dollar Index Fundamentals Overview

From a fundamental perspective, the US dollar index is trading at the back of a relatively busy period in the US market. On Thursday, the ISM Services PMI for July missed the expected reading of 53 with a reading of 52.7. The ISM Services Prices Paid for the period outperformed the expected reading of 52.1 with a reading of 56.8.
On the other hand, the ISM Services Employment Index and New Orders Index both missed the estimated reading of 51.1 and 55.6 with readings of 50.7 and 55. Factory orders of June outshone the forecasted (MoM) change of 2.2% with a change of 2.3%.
Elsewhere, the initial jobless claims for the week ending July 28 matched the expected claim count of 227k. The US non-farm productivity for Q2 beat the expected change of 2% with a change of 3.7% within the Unit Labour Costs for the period fell short of the forecasted change of 2.6% with a change of 1.6%.
The US Dollar Index Technical Analysis (the 60-min Chart)
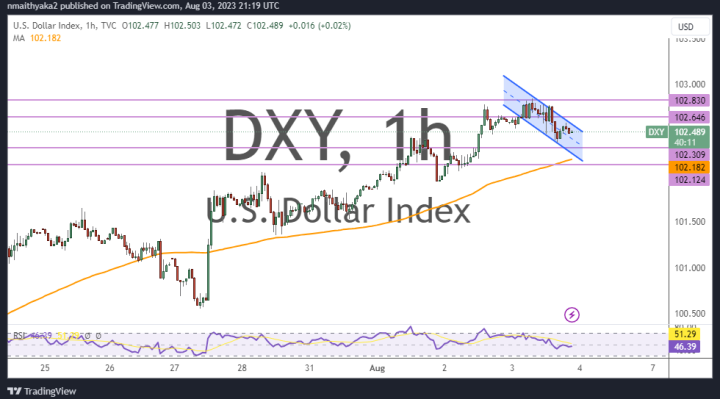
Technically, the US dollar currency index seems to be trading within a descending channel formation in the 60-min chart. This indicates a significant short-term bearish bias in the market sentiment.
Therefore, the bears will be looking to extend the current run of declines toward 102.309 or lower to 1.02.124. On the other hand, the bulls will look to pounce for profits at about 102.646 or higher at 102.830.
The US Dollar Index Technical Analysis (the Daily Chart)
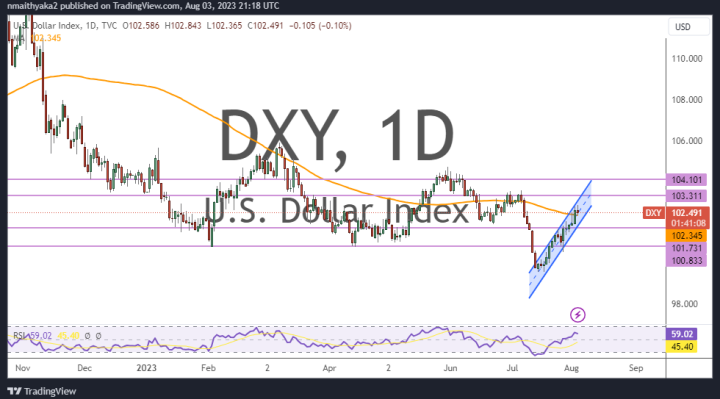
In the daily chart, the US dollar index appears to be trading within an ascending channel formation. This indicates a significant long-term bullish bias in the market sentiment.
Therefore, the bulls will be looking to ride the current wave of gains toward 103.311 or higher to 104.101. On the other hand, the bears will be targeting long-term profits at about 101.731 or lower at 100.833.