
The US dollar index on Friday pulled back to trade below the 100-hour moving average line after Thursday’s breakout. The USDX continues to trade within a sideways channel formation despite the pullback.
The DXY appears to have found solid support around 106.350, which triggered a late rebound, trimming session losses. The US dollar currency index also appears to be trading centrally in the 14-hour RSI.
The US Dollar Index Fundamentals Overview

From a fundamental perspective, the USDX is trading at the back of a relatively busy period in the US market. On Friday, the preliminary US S&P Global Composite PMI for July missed the expectation of 51.7 with 47.5. On the other hand, the Manufacturing PMI for the period beat the expectation of 52 with 52.3, while the Services PMI came short of 52.6 with 47.
On Thursday, the US initial jobless claims for the week ending July 15 missed the expected claim count of 240k with a higher tally of 251k, while the continuing claims for the preceding week came in at 1.384 million compared to a forecasted tally of 1.34 million.
Elsewhere, the Philadelphia Fed Manufacturing PMI for July missed the expectation of 0 with -12.3. Earlier in the week, US housing starts for June missed the expectation of 1.585 million with a tally of 1.559 million, while building permits beat 1.65 million with 1.685 million (MoM).
The US Dollar Index Technical Analysis (the 60-min Chart)
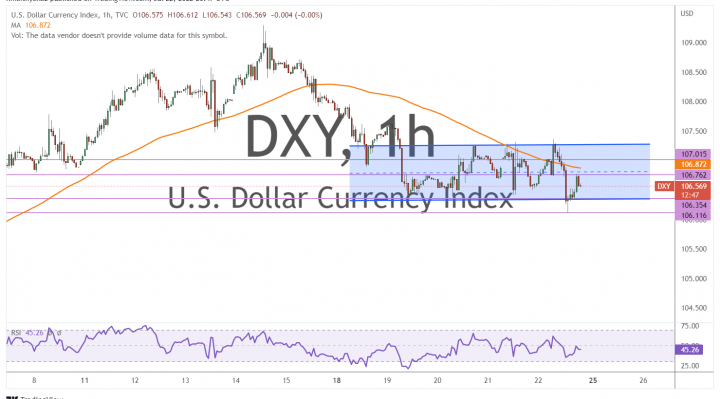
Technically, the US dollar currency index seems to be trading within a volatile sideways channel formation in the 60-min chart. This indicates a strong battle between the bulls and the bears in the market sentiment.
Therefore, following Friday’s late pullback, the bulls will be looking for potential rebounds at about 106.765, or higher at 107.015. On the other hand, the bears will look to extend pullbacks toward 106.354 or lower to 106.116.
The US Dollar Index Technical Analysis (the Daily Chart)
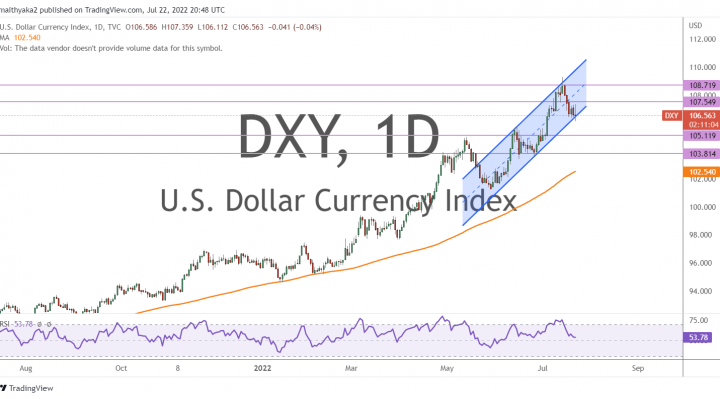
In the daily chart, the US dollar index appears to be trading within an ascending channel formation. This indicates a significant long-term bullish bias in the market sentiment.
Therefore, the bulls will be looking to retain control of the currency index by targeting profits at about 107.549, or higher at 108.719. On the other hand, the bears will be targeting long-term profits at about 105.119, or lower at 103.814.