
The US dollar index on Thursday pulled back from the current weekly highs of about 90.17 to trade at 89.88, just off the 100-hour MA. The USDX later recovered to settle at around 90.00 after the US data.
The dollar currency index continues to trade within a descending channel formation in the 60-min chart. Thursday’s pullback pushed the DXY from the overbought level of the 14-hour RSI back to the normal trading zone.
The US Dollar Index Fundamentals Overview

From a fundamental perspective, the USDX is trading at the back of a very busy period in the US market. On Friday, the US durable goods orders for April missed the expected change of 0.7% with -1.3%. Nondefense capital goods orders ex-aircraft beat the expected change of 0.8% with 2.3% while durable goods orders ex-transportation outshone 0.8% with 1%.
On the other hand, initial jobless claims for the week to May 21 beat 425k with 406k while the preliminary core personal consumption expenditures for Q1 beat 2.3% with 2.5%. On the other hand, preliminary GDP for Q1 beat the (QoQ) expectation of 4.1% with 4.3% but missed on an annualized basis with 6.4% versus 6.5%.
Earlier in the week, the revised S&P/case-Shiller Home Price Indices for March came in better than expected at 13.3% versus 11.7% (YoY). On the other hand, new home sales for April missed 0.95 million with 0.863 million.
The US Dollar Index Technical Analysis (the 60-min Chart)
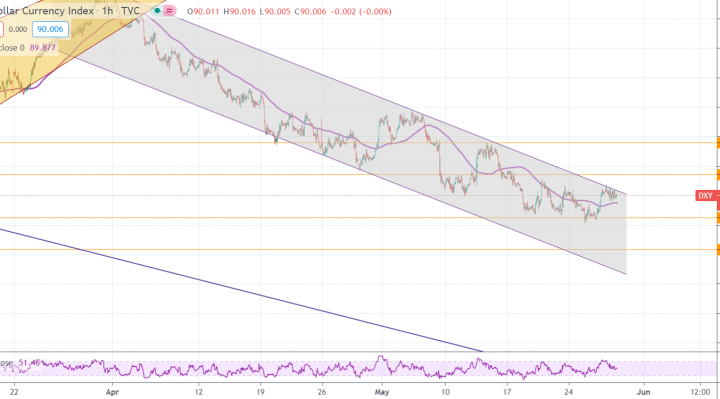
Technically, the US dollar index appears to be trading within a descending channel formation in the 60-min chart. It recently pulled back to move to the normal trading zone of the 14-hour RSI. The USDX continues to trade under significant bearish bias in the short term.
The bulls will be targeting short-term rebond profits at around 90.35 or higher at 90.90. On the other hand, the bears will look to stretch the current declines towards 89.62 or lower to 89.08.
The US Dollar Index Technical Analysis (the Daily Chart)
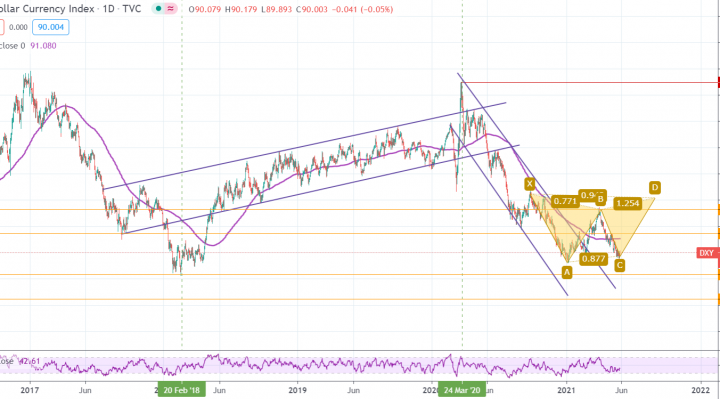
In the daily chart, the DXY appears to be on course to complete the double-bottom pattern formation. This could trigger the next reversal. The US dollar currency index continues to trade closer to the oversold levels of the 14-day RSI.
The bulls will be looking for a completion of the reversal pattern by targeting profits at around 91.45 or higher at 93.30. On the other hand, the bears will target more downward movements at 88.32 or lower at 86.48.