
The US dollar index (DXY) on Wednesday plunged to trade at around 90.20 before finding support from the 100-hour SMA. The USDX is now pinned between the 100-hour SMA and the 200-hour SMA. It continues to trade within a descending channel formation in the 60-min chart.
The pair remains central in the 14-hour RSI. This trend could continue on Thursday and potentially through early next week.
The US Dollar Index Fundamentals Overview

From a fundamental perspective, the DXY is trading at the back of a relatively busy period in the US market. The market is expected to on Thursday and Friday amid the Christmas holiday celebrations. Therefore, a lot of the economic data came out on Wednesday.
The US durable goods orders for November beat the expectation of 0.6% with a change of 0.9%. The nondefense capital goods orders ex-aircraft missed the expected change of 0.6% with a change of 0.4%. On the other hand, durable goods orders ex-transportation missed the expected change of 0.5% with a change of 0.4%.
Personal income for November came short of the expected (MoM) change of -0.3% with a change of -1.1% while personal spending for the period missed -0.2% with a change of -0.4%. On the other hand, initial jobless claims for the week ending December 18 beat the expected claim count of 885k with a tally of 803k claims. Continuing claims for the preceding week outperformed 5.558M with a claim count of 5.337M. Earlier in the week, the US GDP for Q3 beat the expectation of -2% with 3.7%. The annualized equivalent also outshone 33.1% with 33.4%.
The US Dollar Index Technical Analysis (the 60-min Chart)
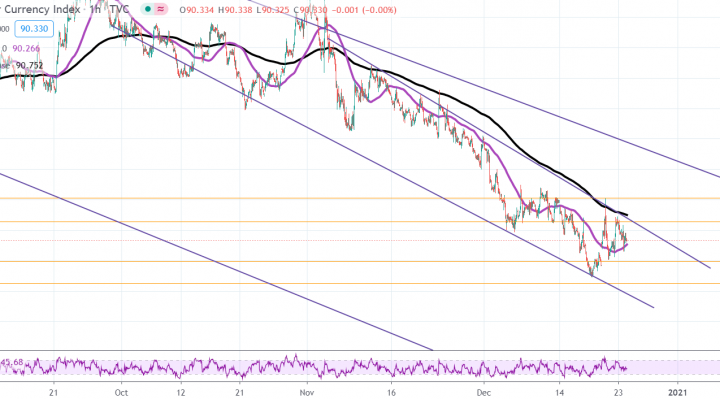
Technically, the US Dollar Index appears to be trading within a descending channel formation in the 60-min chart. This indicates a significant short-term, bearish pressure in the market sentiment.
The bulls will be targeting short-term rebound profits at around 90.64 or higher at 91.03. On the other hand, the bears will look to ride the current bearish run towards 89.98 or lower to 89.62.
The US Dollar Index Technical Analysis (the Daily Chart)
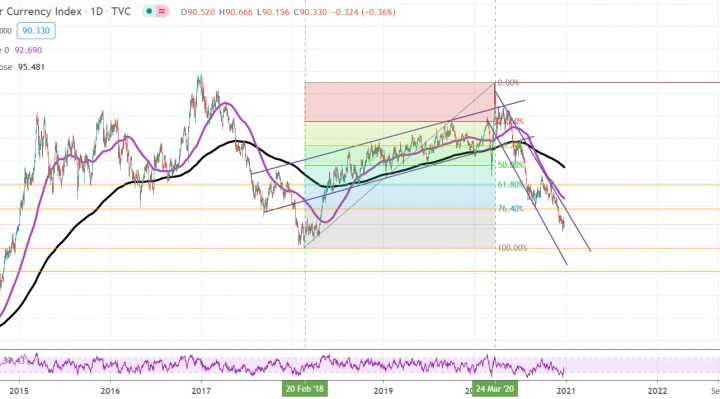
In the daily chart, the USDX appears to be trading within a sharply descending channel formation. This indicates a strong long-term bearish bias in the market sentiment. The DXY has recently bounced off oversold levels of the 14-day RSI.
The bulls will be looking to build on this rebound by targeting profits at around 91.73 or higher at 93.86. On the other hand, the bears will look to pounce on long-term profits at around 88.25 or lower at 86.13.