
The US dollar index (DXY) on Friday found support around the 92.80 level after the latest pullback. This came at the back of disappointing US retail sales data. The USDX has now bounced back to trade at around 93.00 level is a slightly rising channel.
In the broader picture, the USDX appears to be pinned within a sideways channel. It has now made some gains to trade just off the 100-hour SMA. The 200-hour SMA remains a few levels higher. In the 14-hour RSI, the dollar index appears to be trading within the normal zone following Friday’s late rebound.
The US Dollar Index Fundamentals Overview

From a fundamental perspective, the USDX is trading at the back of a relatively busy session in the US market. On Wednesday, the US retail sales for August missed the (MoM) expectation of 1% with 0.6%. On the other hand, the retail sales control group came short of the expected change of 0.5% with a change of -0.1%. Retail sales ex-autos also disappointed with a change of 0.7% versus the expected change of 0.9% (MoM). The Federal Reserve chose to keep the base interest rate unchanged at 0.25% as expected.
On Thursday, the initial jobless claims for the week ending Sep. 11 missed the expectation of 850k with 860k. On the other hand, continuing claims outperformed 13M with 12.628M while building permits and housing starts for August missed expectations (MoM). On Friday, the preliminary Michigan consumer sentiment index for Sep. beat the expectation of 75 with 78.9.
The US Dollar Index Technical Analysis (the 60-min Chart)
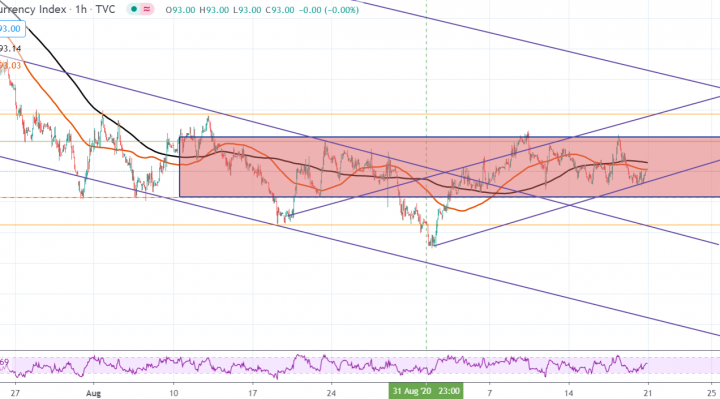
Technically, the USDX appears to be trading within a sideways channel in the 60-min chart. This indicates a cyclical sentiment in the market. The bulls appear to be edging the battle slightly after the recent trend formation.
They will be targeting short-term profits at around 93.48 or higher at 93.93. On the other hand, the bears will look to pounce for pullback profits at around 92.57 or lower at 92.12.
The US Dollar Index Technical Analysis (the Daily Chart)
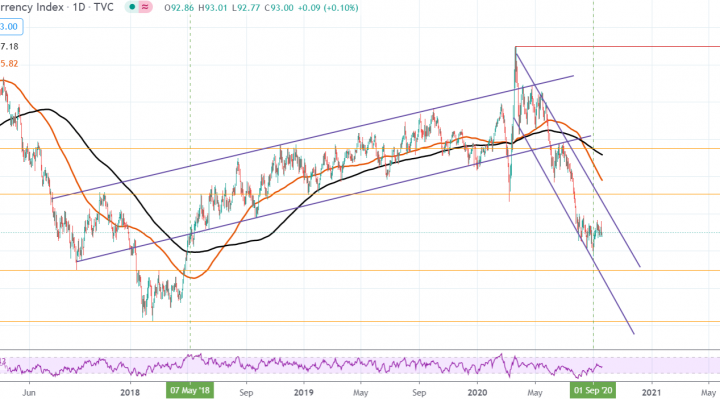
In the daily chart, the DXY appears to be trading in a sharply descending channel. This indicates a strong bearish bias in the market sentiment. The dollar index has recently bounced back off the trendline support to set up a recovery.
The bulls will be targeting long-term profits at around 95.05 or higher at 97.50. On the other hand, the bears will look to pounce for profits at around 90.98 or lower at 88.23.