
The US dollar index on Friday pulled back off session highs of about 101.700 to trade at about 101.200 after the latest round of US data. The USDX continues to trade within a highly volatile ascending channel formation in the 60-min chart.
The dollar currency index has now dropped to trade several levels below the 100-hour moving average line. The pullback prevented the DXY from ascending to the overbought levels of the 14-hour RSI.
The US Dollar Index Fundamentals Overview

From a fundamental perspective, the US dollar currency index is trading at the back of a relatively busy period in the US market. On Friday, the US jobs data for April outperformed the expectation of 179k with a job tally of 253k. The unemployment rate for the month also fell from 3.5% in March to 3.4%, beating the expected rate of 3.5%, while the average hourly wage for the period outshone the (YoY) expectation of 4.2% with a change of 4.4%. The Labour Force Participation rate for the period also beat the forecasted rate of 62.5% with a change of 62.6%.
Earlier in the week, the initial jobless claims for the week ending April 28 missed the expected claim count of 240k with a slightly higher tally of 242k. The continuing claims for the preceding period beat the forecasted tally of 1.863 million with a lower claim count of 1.805 million. Elsewhere, both the ISM Manufacturing PMI and ISM Services PMI for April outperformed estimates, while the S&P Global Manufacturing, Services and Composite PMIs fell short of estimates.
The US Dollar Index Technical Analysis (the 60-min Chart)
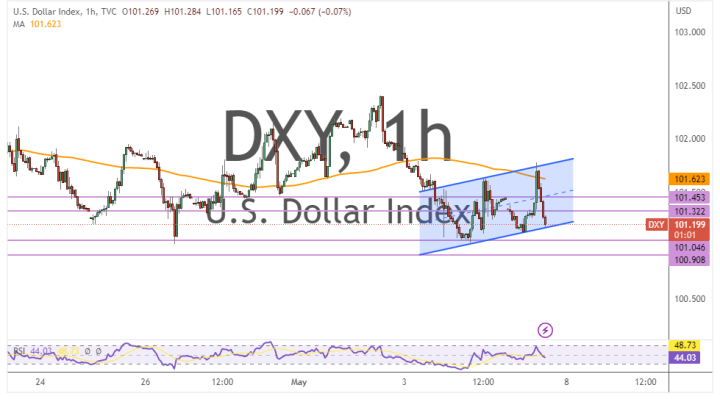
Technically, the US dollar index appears to be trading within an ascending channel formation in the 60-min chart. This indicates a significant short-term bullish bias in the market sentiment.
Therefore, the bulls will be looking to pounce on potential rebounds at about 101.322 or higher at 101.453. On the other hand, the bears will look to extend the current pullback toward 101.046 or lower to 100.908.
The US Dollar Index Technical Analysis (the Daily Chart)
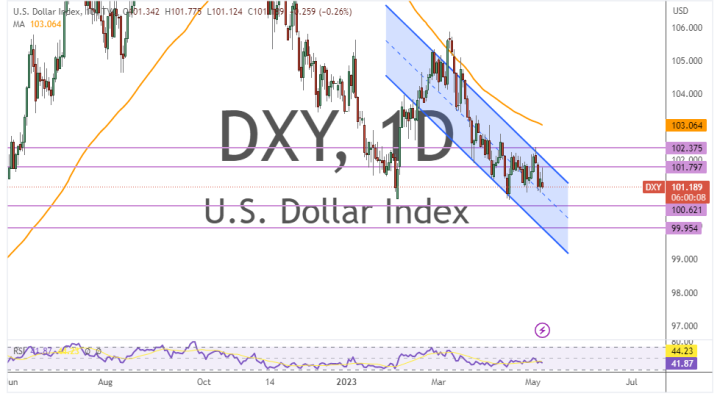
In the daily chart, the US dollar currency index seems to be trading within a descending channel formation. This indicates a significant long-term bearish bias in the market sentiment.
Therefore, the bears will be targeting long-term profits at about 100.621 or lower at 99.954. On the other hand, the bulls will look to pounce on profits at about 101.797 or higher at 102.375.