
The US Dollar Index on Friday spiked to trade at a new week high of about 94.28 before pulling back later to settle at 94.13. The USDX seems to have skyrocketed from cut through the channel formation in the 60-min chart.
The DXY is now pinned several levels above the 100-hour moving average after Friday’s rally. It has also moved into the overbought conditions of the 14-hour RSI. However, the late pullback could push it back to the normal trading zone.
The US Dollar Index Fundamentals Overview

From a fundamental perspective, the US dollar currency index trades at the back of a relatively busy period in the US market. Although most tech stocks were disappointing in the latest earnings reports amid supply chain constraints, some key economic data helped push the USDX higher. On Friday, the Chicago Purchasing Managers’ Index for October beat the expectation of 63.5 with 64.8. On the other hand, the Michigan Consumer Sentiment Index for the same period was slightly above estimates with 71.7 versus 71.4.
Elsewhere, Personal Spending for September beat the expectation of 0.5% with a change of 0.6% while personal income missed -0.2% with -1%. The core personal consumption expenditures price index for September missed the expected (YoY) change of 3.7% with 3.6%, while the (MoM) equivalent matched estimates. Earlier in the week, the initial jobless claims for last week beat the expectation of 290k with 281k, while the continuing claims for the preceding period outshone 2.415 million with 2.243 million.
The US Dollar Index Technical Analysis (the 60-min Chart)
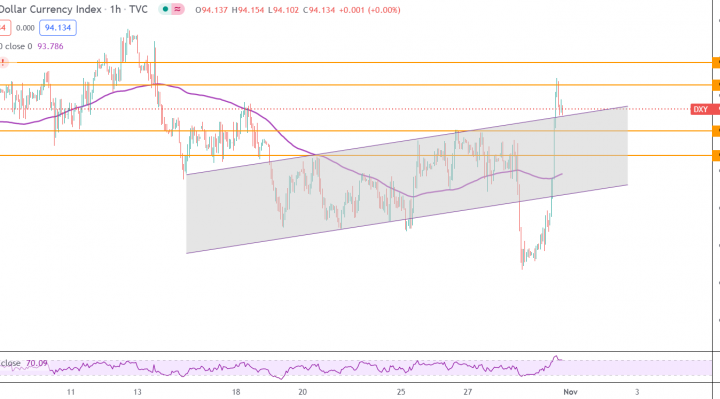
Technically, the US dollar index appears to have recently spiked to trade at a new week high before pulling back late to trim the gains. This indicates an abrupt change in the market sentiment from bearish to bullish.
Therefore, the bulls will be looking to ride the current bull-run by targeting profits at about 94.26, or higher to 94.38. On the other hand, the bears will target extended pullbacks at about 94.02 and 93.88.
The US Dollar Index Technical Analysis (the Daily Chart)
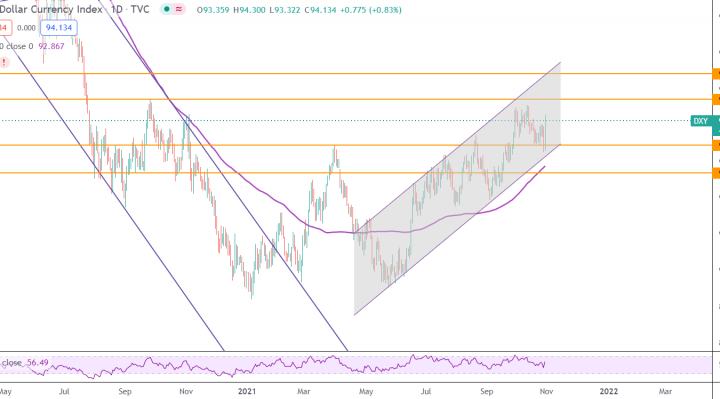
In the daily chart, the US dollar currency index seems to be trading within an ascending channel formation. This indicates a significant long-term bullish bias in the market sentiment.
Therefore, the bulls will be looking to ride the current rally towards 94.71 or higher to 95.42. On the other hand, the bears will be targeting long-term profits at about 93.46 or lower at 92.69.