
The US dollar index on Wednesday pulled back off the current 5-month highs of about 93.44 to trade at around 93.00 before recovering late on to 93.20. The USDX continues to trade within an ascending channel formation in the 60-min chart.
The US dollar currency index is now pinned just above the 100-hour SMA while the 200-hour SMA is several levels below. Wednesday’s late rebound prevented the DXY from crossing to oversold levels of the 14-hour RSI.
The US Dollar Index Fundamentals Overview

From a fundamental perspective, the USDX is trading ahead of a relatively busy period in the US market. April marks the start of the next earnings season in the US stock market. This could increase trading activity thereby strengthening the dollar index. Earlier this week, the S&P/Case-Shiller Home Price Indices for January beat the expected (YoY) change of 11% with a change of 11.1%. The housing price index for January posted a change of 1% (MoM) compared to a previous reading of 1.2%.
On Wednesday, the US ADP employment change for March missed the expected job count of 550k with a tally of 517k. The Chicago Purchasing Managers’ Index for March outperformed the expectation of 60.7 with 66.2. On the other hand, pending home sales for January missed the (MoM) expectation of -2.6% with a change of -10.6%. Traders will be looking forward to Thursday’s ISM Manufacturing PMI and Friday’s non-farm payroll data.
The US Dollar Index Technical Analysis (the 60-min Chart)
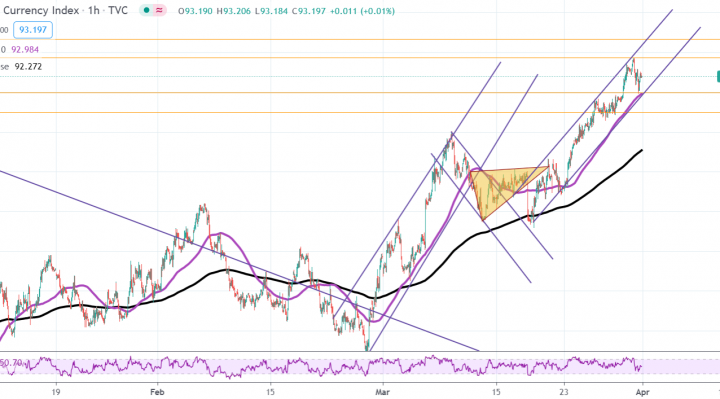
Technically, the US dollar currency index appears to be trading within an ascending channel formation in the 60-min chart. This indicates a short-term bullish bias in the market sentiment.
The bears will be targeting short-term pullback profits at around 92.99 or lower at 92.74. On the other hand, the bulls will look to ride the current bull-run towards 93.44 or higher to 93.67.
The US Dollar Index Technical Analysis (the Daily Chart)
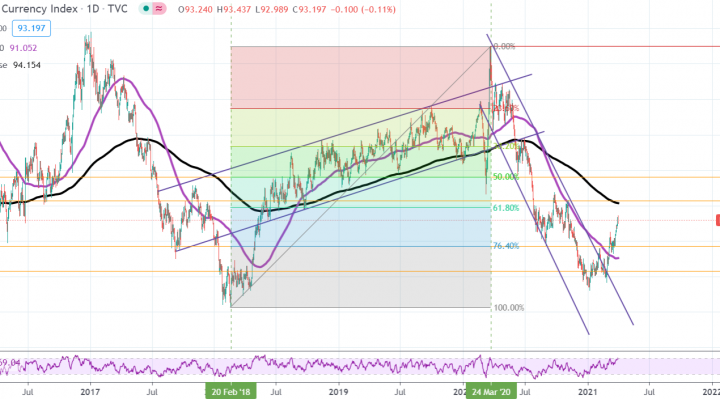
In the daily chart, the USDX appears to have recently broken out from a sharply descending channel formation. It has now rallied to cross to overbought levels of the 14-day RSI. This indicates an attempt by the bulls to trigger a market reversal.
They will be targeting long-term profits at around 94.27 or higher at the 50% fib level at 95.63. On the other hand, the bears will target profits at around the 76.40% fib level at 91.71 or lower at 90.31.