
The US dollar index on Friday pulled back off session highs of about 104.22 to trade at about 104.12 after the latest US data. The DXY appears to be trading within a sideways channel formation in the 60-minute chart.
The dollar currency index continues to trade a few levels above the 100-hour moving average line. As a result, the USDX still seems to have a lot of room left to run before reaching the oversold levels of the 14-hour RSI.
The US Dollar Index Fundamentals Overview

From a fundamental perspective, the US dollar index is trading at the back of a relatively busy period in the US market. On Thursday, the initial jobless claims for the week ending February 23 missed the expectation of 210k with a claim count of 215k. The Chicago Purchasing Managers’ Index for February also fell short of 48 with a reading of 44.
On the other hand, the pending home sales for January missed the expected change of 1% with a change of -4.9% (MoM). Elsewhere, personal income for January outshone the estimate of 0.4% with a change of 1%, while personal spending was in line with the forecasted change of 0.2%.
The personal consumption expenditures price index for January matched the expected (MoM) and (YoY) forecasts of 0.3% and 2.4%, respectively. The core personal consumption expenditures price index for the period was also in line with the estimates of 0.4% (MoM) and 2.8% (YoY).
Looking forward, traders will be waiting for the US ISM Manufacturing PMI data, which is expected to improve slightly to 49.5 up from 49.1. The Michigan Consumer Sentiment Index for February is forecasted to steady at 79.6.
The US Dollar Index Technical Analysis (the 60-min Chart)
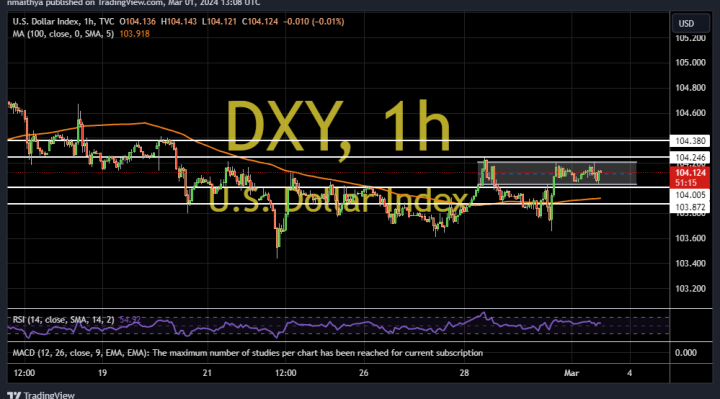
Technically, the US dollar index appears to be trading within a sideways channel formation in the 60-minute chart. However, the 14-hour RSI appears to be moving closer to the overbought conditions, indicating a slight bullish bias.
Therefore, the bulls will be targeting short-term profits at about 104.24 or higher at 104.38. On the other hand, the bears will look to pounce on pullbacks at about 104.00 or lower at 103.87.
The US Dollar Index Technical Analysis (the Daily Chart)
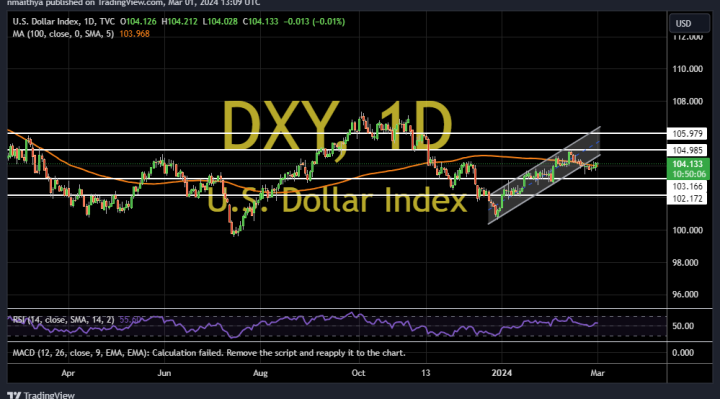
In the daily chart, the US dollar currency index appears to have recently completed a downward breakout from an ascending channel formation. However, the 14-day RSI has recently bounced back to avoid falling into oversold conditions.
Therefore, the bulls will be targeting extended rebounds at about 104.98 or higher at 105.98. On the other hand, the bears will be targeting long-term profits at about 103.16 or lower at 102.17.