
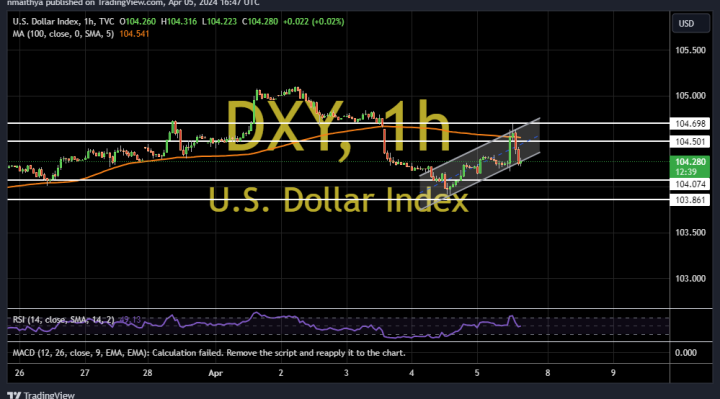
The US dollar index on Friday pulled back off the session highs of about 104.70 to trade at about 104.28 after US NFPs. The DXY continues to trade within an ascending channel formation in the 60-minute chart.
Friday’s pullback prevented the dollar currency index from advancing above the 100-hour moving average line. As a result, the USDX avoided rallying into the overbought levels of the 14-hour RSI.
The US Dollar Index Fundamentals Overview

From a fundamental perspective, the US dollar index is trading at the back of a relatively busy period in the US market. On Friday, the US unemployment rate outperformed the projected rate of 3.9% with a rate of 3.8%, also falling slightly below last month’s equivalent of 3.9%.
The US jobs data for the month also exceeded the forecasted job tally of 200k with a significantly higher figure of 303k. On the other hand, the average hourly wage growth for the period matched the expected (MoM) and (YoY) changes of 0.3% and 4.1%, respectively.
Earlier in the week, the US ISM Services PMI for March missed the forecasted reading of 52.7 with a reading of 51.4. On the other hand, the ISM Manufacturing PMI for the period outshone the forecast of 48.4 with a reading of 50.3, while the ISM Manufacturing Prices Paid beat 52.6 with 55.8.
The ADP Employment Change for March also came in stronger than expected with 184k jobs versus a forecast of 148k, while JOLTS job openings for February beat 8.74 million with 8.756 million. Elsewhere, factory orders for February outshone the estimated (MoM) change of 1% with a change of 1.4%.
The US Dollar Index Technical Analysis (the 60-min Chart)
Technically, the US dollar index appears to be trading within an ascending channel formation in the 60-minute chart. However, the 14-hour RSI has recently pulled back to avoid rallying into overbought conditions.
Therefore, the bears will be targeting extended pullbacks at about 104.07 or lower at 103.86. On the other hand, the bulls will look to recoup losses at about 104.50 or higher to 104.70.
The US Dollar Index Technical Analysis (the Daily Chart)
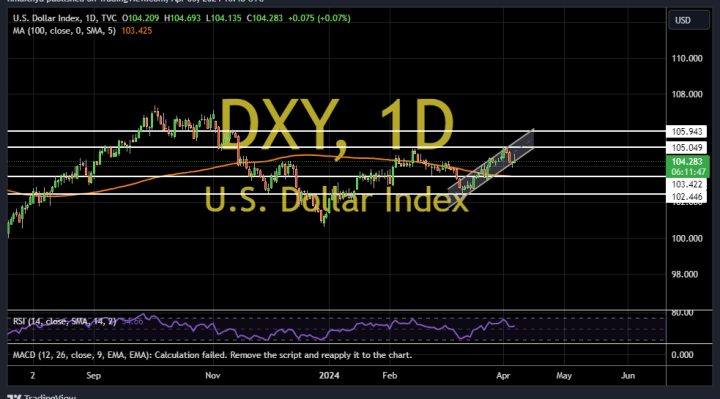
In the daily chart, the US dollar index appears to be trading within an ascending channel formation. However, the 14-day RSI also seems to have pulled back, thus avoiding rallying into overbought conditions.
Therefore, the bears will be targeting more pullback profits at about 103.42 or lower at 102.44. On the other hand, the bulls will be targeting long-term profits at about 105.05 or higher at 105.94.