
On Friday, the US dollar index pulled back off the session highs of about 106.12 to trade at about 105.70. The DXY trades within a descending channel formation in the 60-minute chart.
The dollar currency index continues to trade a few levels below the 100-hour moving average line. Friday’s late pullback pushed the USDX closer to the oversold levels of the 14-hour RSI.
The US Dollar Index Fundamentals Overview

From a fundamental perspective, the US dollar currency index trades after a relatively busy period in the U.S. market. The Thanksgiving holiday celebration on Thursday and Black Friday following right after, all US economic data this week was out by Wednesday.
The preliminary annualised U.S. gross domestic product for Q3 was in line with the estimate of 2.8%, unchanged from the preceding quarter, while the preliminary gross domestic product – price index beat 1.8% with a change of 1.9%, up from 1.8%. On the other hand, the Chicago Purchasing Managers’ Index for November fell short of the forecasted reading of 44.7 with a reading of 40.2.
Elsewhere, the durable goods orders for October missed the expected change of 0.5% with a change of 0.2%. The durable goods orders ex-transportation also failed to match the expectation of 0.2% with a change of 0.1%.
On the other hand, the personal income for the month beat the forecast of 0.3% with a change of 0.6% (MoM), while personal spending outshone 0.3% with a change of 0.4%. The initial jobless claims for the week ending November 22 edged lower to 213k, down from 215k in the preceding week, beating the estimate of 217k.
The US Dollar Index Technical Analysis (the 60-min Chart)
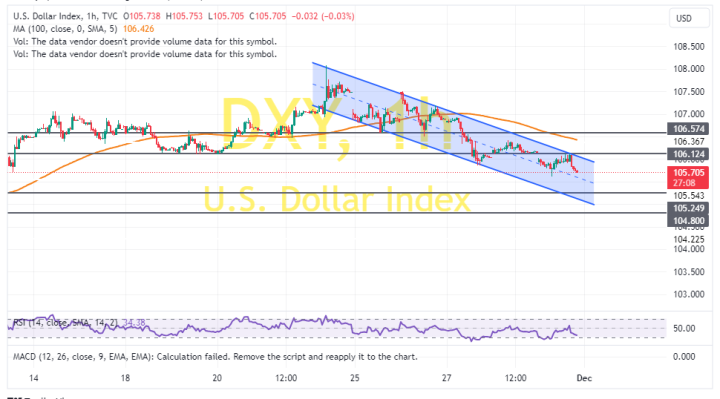
Technically, the US dollar trades within a descending channel formation in the 60-minute chart. The 14-hour RSI has recently pulled back to move closer to oversold conditions, supporting a bearish bias.
Therefore, the bears will try to extend the current decline towards 105.25 or lower to 104.80. On the other hand, the bulls will target potential rebound profits at about 106.12 or higher at 106.57.
The US Dollar Index Technical Analysis (the Daily Chart)
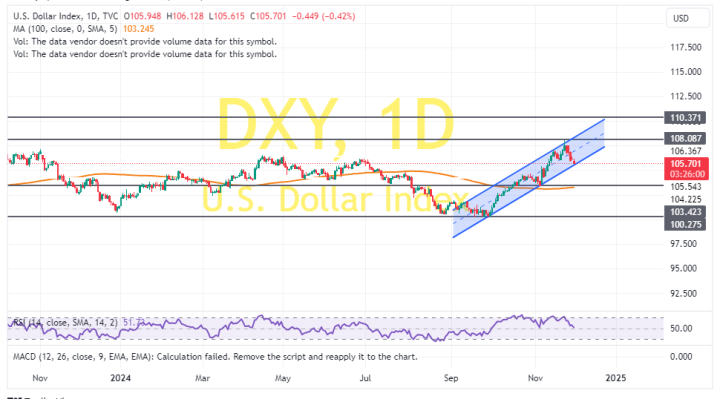
In the daily chart, the dollar currency index trades within an ascending channel formation. However, the 14-day RSI has recently pulled back to avoid rallying into overbought conditions.
Therefore, the bears will be targeting extended pullbacks at about 103.42 or lower at 100.27. On the other hand, the bulls will look to ride the current rally towards 108.08 or higher to 110.37.