
The US dollar currency index on Friday pulled back off session highs of about 102.274 to trade at about 101.980. The USDX appears to be trading within a sideways channel formation in the 60-min chart.
The dollar currency index has now pulled back to trade below the 100-hour moving average line. As a result, the DXY seems to be moving closer to the oversold levels of the 14-hour RSI.
The US Dollar Index Fundamentals Overview

From a fundamental perspective, the US dollar index is trading at the back of a relatively busy period in the US market. On Friday, the US existing home sales for December outperformed the expected tally of 1.396 million with a higher tally of 1.402 million. On the other hand, existing home sales change for the period beat the forecast of -5.4% with a change of -1.5%. Earlier in the week, new housing starts beat the expected tally of 1.359 million with a higher count of 1.382 million (MoM), while building permits for December missed the estimate of 1.37 million with 1.33 million.
Elsewhere, the initial jobless claims for the week ending January 13 outperformed the expected claim count of 214k with a lower tally of 190k. Continuing claims for the preceding week also beat the estimate of 1.66 million with a tally of 1.647 million, while the Philadelphia Fed Manufacturing Survey outperformed the expected reading of -11 with a reading of 8.9.
The US Dollar Index Technical Analysis (the 60-min Chart)
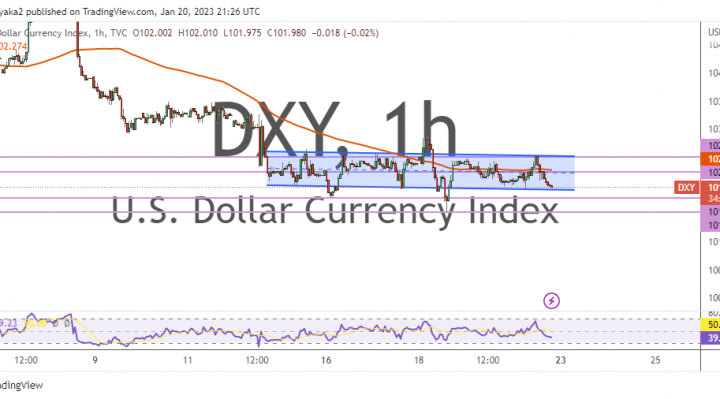
Technically, the US dollar index appears to be trading within a sideways channel formation in the 60-min chart. This indicates a lack of clear directional bias in the market sentiment.
Therefore, the bulls will be targeting potential rebound profits at about 102.240 or higher at 102.507. On the other hand, the bears will look to pounce on downward breakouts at about 101.777 or lower at 101.525.
The US Dollar Index Technical Analysis (the Daily Chart)
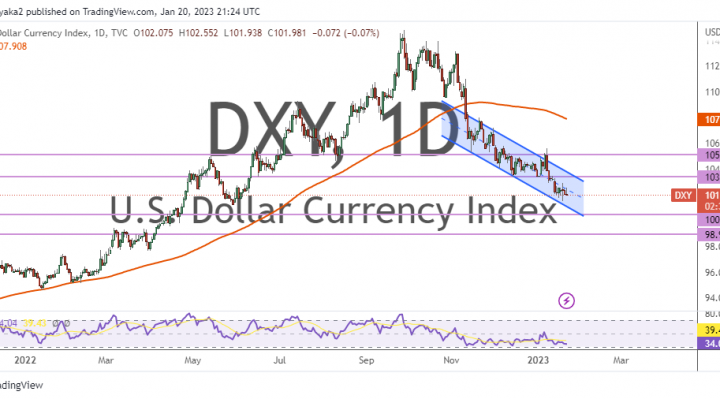
In the daily chart, the USDX appears to be trading within a descending channel formation. This indicates a significant long-term bearish bias in the market sentiment.
Therefore, the bears will be looking to extend the current run of declines toward 100.500 or lower to 99.940. On the other hand, the bulls will look to pounce on profits at about 103.405 or higher at 105.117.