
The US dollar index on Wednesday pulled back off the current monthly highs of about 94.45 to trade at 94.23 after the US data. The USDX continues to trade within an ascending channel formation in the 60-min chart.
The dollar currency index also remains pinned several levels above the 100-hour moving average despite the pullback. However, the decline pushed it back to the normal trading zone of the 14-hour RSI, off the overbought levels.
The US Dollar Index Fundamentals Overview

From a fundamental perspective, the DXY is trading at the back of a relatively busy period in the US market. On Wednesday, the US ADP employment change for September beat the expectation of 428k with 568k. On the other hand, the MBA Mortgage applications for the week ending October 1 fell by 6.9% compared to the previous week’s decline of 1.1%.
Earlier in the week, the US ISM Services PMI for September outperformed the expectation of 60 with 61.9. The ISM Services New Orders Index also outshone 62.3 with 63.5, while the ISM Services Price Paid and Employment Index, both missed 79.3 and 53.7, respectively with 77.5 and 53. On the other hand, the Markit Services PMI and the PMI Composite beat 54.4 and 54.5, respectively with 54.9 and 55.
Elsewhere, factory orders for August beat the expected (MoM) change of 0.9% with a change of 1.2%, while goods and services trade balance missed -$70.5 billion with -$73.3 billion.
The US Dollar Index Technical Analysis (the 60-min Chart)
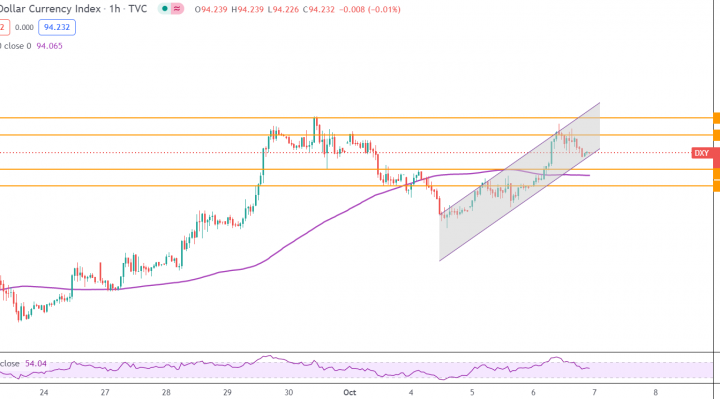
Technically, the USDX appears to be trading within an ascending channel formation in the 60-min chart. This indicates a significant short-term bullish bias in the market sentiment. However, it has recently pulled back to return to the normal trading zone of the 14-hour RSI.
The bears will be looking to extend the current pullback towards 94.10 or lower to 93.99. On the other hand, the bills will target short-term profits at around 94.36 or higher at 94.49.
The US Dollar Index Technical Analysis (the Daily Chart)
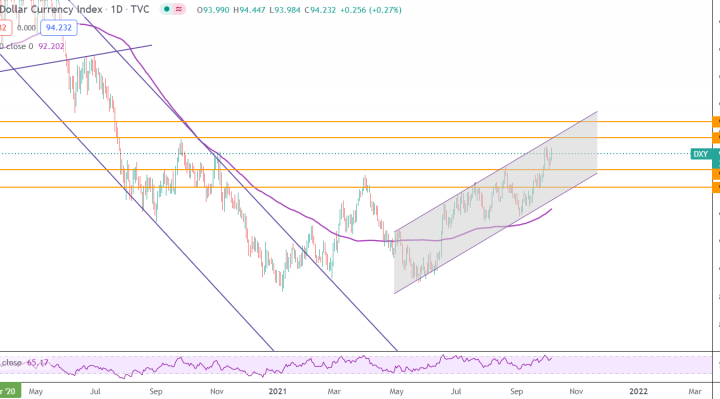
In the daily chart, the dollar currency index also seems to be trading within an ascending channel formation. As a result, it has surged closer to the overbought levels of the 14-day RSI. Therefore a pullback could be imminent.
The bulls will be looking to ride the current bull-run by targeting profits at around 94.80 or higher at 95.38. On the other hand, the bears will target long-term profits at 93.64 or lower at 92.99.