
The US dollar index (DXY) on Wednesday extended the current weekly gains towards 91.20 before pulling back late on to settle at 91.07. The USDX appears to have found support from the 100-hour SMA in the 60-min chart, which boosted today’s rally.
The pair is now pinned between the 100-hour and the 200-hour SMA lines within a descending channel. Today’s late pullback prevented it from crossing to overbought levels of the 14-hour RSI.
The US Dollar Index Fundamentals Overview

From a fundamental perspective, the US dollar index is trading ahead of a relatively significant period in the US market. On Wednesday, traders will be looking forward to the US consumer price index data for November. More companies are also expected to release earnings results as we move closer to wrapping up the Q3 earnings season. Positive covid-19 vaccine news is also boosting market optimism, which could strengthen the dollar index further. But fears of increasing covid cases continue to put breaks on the recovery.
On Tuesday, the US nonfarm productivity for Q3 missed the expected change of 5% with a change of 4.6%. On the other hand, unit labor costs for the same period outperformed -8.9% with a change of -6.6%. Earlier in the week, the consumer credit change for October missed $16 billion with $7.23 billion. On Wednesday, wholesale inventories for October missed the expected change of 0.9% with a change of 1.1% while JOLTS job openings outperformed 6.3 million with 6.652 million.
The US Dollar Index Technical Analysis (the 60-min Chart)
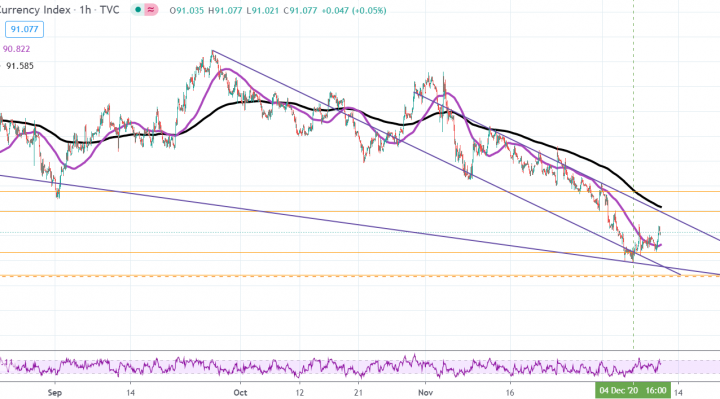
Technically, the US dollar index appears to be trading within a gently descending channel in the 60-min chart. This indicates a slight short-term bearish bias in the market sentiment. The DXY is closer to reaching overbought levels of the 14-hour RSI following this week’s rebound.
The bulls will be looking to ride the current short-term rebound by targeting profits at around 91.49 or higher at 91.89. On the other hand, the bears will look to pounce for profits at around 90.65 or lower at 90.21.
The US Dollar Index Technical Analysis (the Daily Chart)
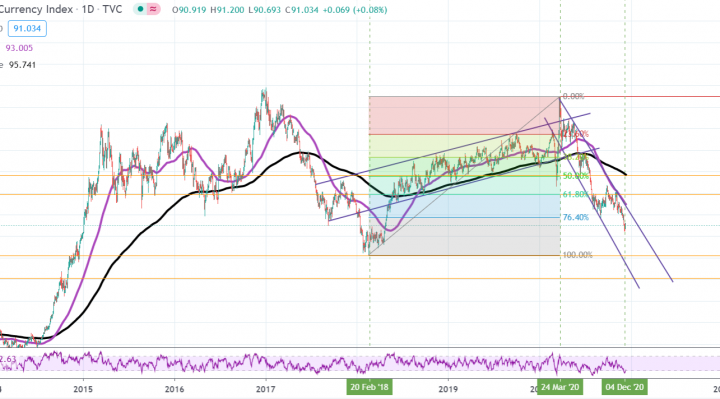
In the daily chart, the USDX appears to be trading within a sharply descending channel. The dollar index has now plummeted below the 76.40% fib level on the way down. This indicates a strong bearish bias in the market sentiment.
The bears will target long-term profits at around 100% fib level at 88.22 or lower at 86.14. On the other hand, the bulls will be hoping for a significant rebound by targeting profits at around 61.80% and 50% fib levels at 93.86 and 95.62, respectively.