
The US Dollar Index on Friday pulled back after setting new yearly highs of 93.74 to trade at around 93.45. The US dollar currency index continues to trade within an ascending channel formation in the 60-min chart.
The USDX also remained pinned several levels above the 100-hour moving average despite Friday’s pullback. In addition, the pullback did not push the DXY to oversold conditions of the 14-hour RSI. Therefore, the downward movement could continue next week.
The US Dollar Index Fundamentals Overview

From a fundamental perspective, the US dollar currency index is trading at the back of a relatively busy period in the US market. On Thursday, the US initial jobless claims data for the week ensign August 13 beat the expectation of 263k with a lower claim count of 248k. On the other hand, the continuing claims for the week ending August 6 missed the expectation of 2.8 million with a higher claim count of 2.82 million. Elsewhere, the Philadelphia Fed Manufacturing Survey for August failed to match the expectation of 23 with 19.4.
Earlier in the week, the US building permits for June beat the (MoM) expectation of 1.1.61 million with a tally of 1.635 million, while housing starts for the period missed 1.6 million with 1.534 million. The retail sales control group for July missed the expected change of -0.1% with a change of -1% while general retails sales came short of -0.3% with -1.1%. On the other hand, retail sales ex-autos came short of 0.1% with -0.4%.
The US Dollar Index Technical Analysis (the 60-min Chart)
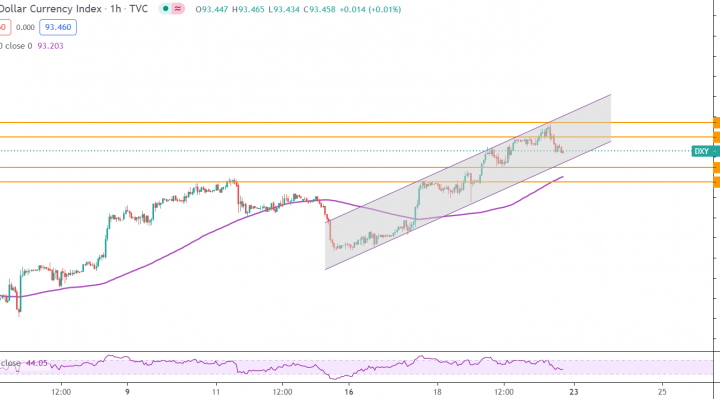
Technically, the USDX seems to have recently pulled back within an ascending channel formation. This indicates an attempt by the bears to take control of the dollar index from the bulls.
They will be targeting short-term profits at approximately 93.30 or lower at 93.15. On the other hand, the bulls will target a potential rebound at around 93.60 or higher at 93.74.
The US Dollar Index Technical Analysis (the Daily Chart)
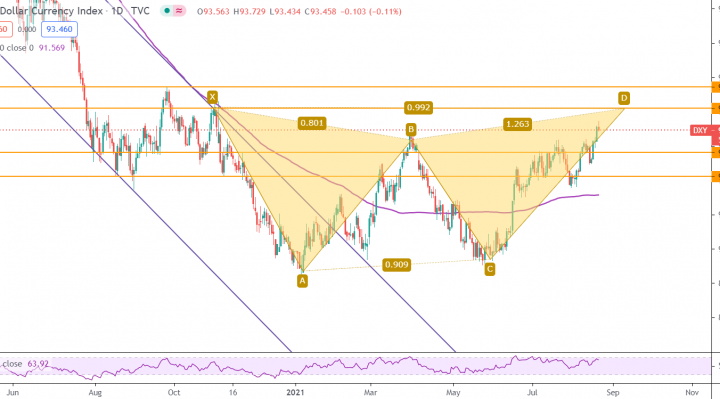
In the daily chart, the USDX seems to be on course to complete a XABCD double-bottom reversal pattern formation after bottoming below 90.00. It has now rallied closer to the overbought conditions of the 14-day RSI.
Therefore, the bulls will be looking to extend the current bull run towards 94.10 or higher to 94.72. On the other hand, the bears will target long-term profits at around 92.80 or lower at 92.11.