
The US dollar index on Friday extended Thursday’s declines towards 92.00 after a disappointing week of US economic data. The USDX ended the week lower after the ISM Services PMI for June missed expectations.
The dollar currency index has now plummeted closer to oversold conditions in the 14-hour RSI. It continues to trade a few levels below the 100-hour moving average in the 60-min chart. The DXY is still pinned within an ascending channel formation.
The US Dollar Index Fundamentals Overview

From a fundamental perspective, the USDX is trading at the back of a relatively busy period in the US market. On Tuesday, the US ISM Services PMI for June followed last week’s disappointing Manufacturing PMIs with another tepid performance. It missed the expectation of 63.5 with 60.1. The ISM Services Employment Index also missed 57 with 49.3 while the Prices Paid and New Orders Index beat 79.3 and 60.3 with 79.5 and 62.1, respectively. The Markit Services PMI for the month and the Markit PMI Composite also came short of expectations.
On Thursday, the US initial jobless claims for the week ending July 2 missed the expected claim count of 350k with a tally of 373k. The continuing claims for the preceding week also came in higher than expected. Wholesale inventories for May missed the expected change of 1.1% after increasing by 1.3% on Friday.
The US Dollar Index Technical Analysis (the 60-min Chart)
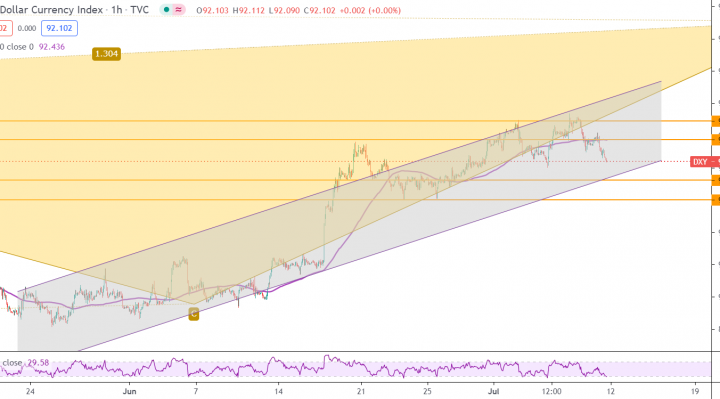
Technically, the USDX appears to be trading within an ascending channel formation in the 60-min chart. The dollar index has recently pulled back to move closer to the oversold levels of the 14-hour RSI.
The bulls will be looking to retain the short-term control of the USDX by targeting profits at about 92.43 or higher at 92.72. On the other hand, the bears will look to extend the current pullback towards 91.80 or lower to 91.50.
The US Dollar Index Technical Analysis (the Daily Chart)
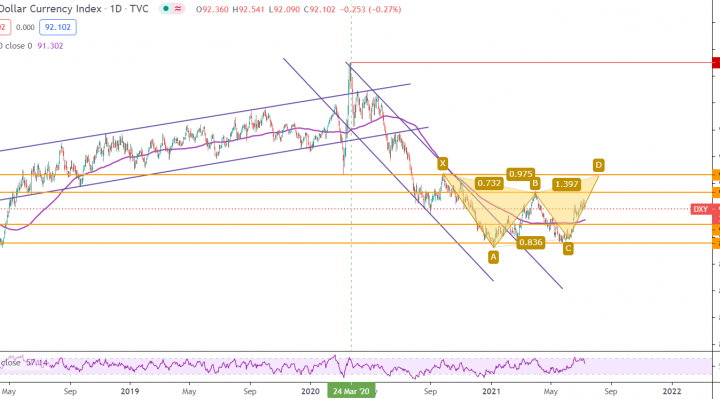
In the daily chart, the dollar index appears to be closer to completing a double-bottom XABCD reversal pattern formation. The USDX recently rallied to hit overbought conditions of the 14-day RSI before finding strong resistance.
The bulls will be looking to ride the current rebound towards 93.32 or higher to 94.62. On the other hand, the bears will target potential pullbacks at about 90.95 or lower at 89.56.