
The US Dollar Index (DXY) on Friday pulled back off the current weekly highs of about 97.48 to trade at 97.12 following the latest round of US data. The USDX had rallied during the day to hit a new 7-day high amid a relative increase in optimism in the US market. This followed Thursday’s estimate beating initial jobless claims of 1.542M versus an expectation of 1.55M.
This week, the DXY has rallied to break out of a descending channel following a XABCD reversal pattern formation. Friday’s late [ullback pushed the dollar index back to the norma; trading zone of the 14-hour RSI in the 60-min chart.
The US Dollar Index Fundamentals Overview

From a fundamental perspective, the US dollar index is trading at the back of a relatively busy period in the US market. On Thursday, the initial jobless claims of the week ending Jun. 5 came in at 1.542M. This was better than the expected figure of 1.55M. On the other hand, continuing claims came in higher than expected at 20.929M versus a consensus estimate of 20M. The producer price index ex-food and energy for May missed the (YoY) expectation of 0.4% with 0.3% while the (MoM) outcome was in line with estimates at -0.1%. The general PPI outperformed -1.2% with -0.8%.
On Friday, the preliminary Michigan Consumer Sentiment Index for June outperformed 75 with 78.9. Earlier in the week, the US CPI underperformed on several levels. The CPI ex-food and energy missed the (MoM) and (YoY) expectations for May with -0.1% and 1.2%, respectively versus 0.0% and 1.3%.
The US Dollar Index Technical Analysis (the 60-min Chart)
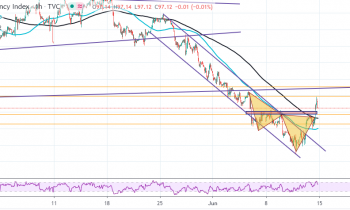
Technically, the US dollar index appears to be have completed a reversal after a sustained period of declines. The USDX has now rallied to hit new weekly highs after bottoming at about 95.70 earlier in the week
The bulls will be looking to extend the current gains towards 97.48 or higher to 97.77. On the other hand, the bears will target short-term pullback profits at around 96.94 or lower at 96.65.
The US Dollar Index Technical Analysis (the Daily Chart)
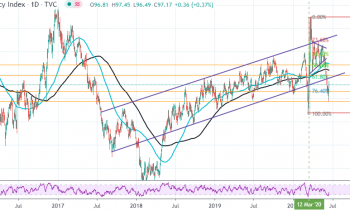
In the daily chart, the USDX appears to be on the way up after the recent pullback. The DXY has now recouped some of the losses to move back towards 61.80% Fib levels on its way to recovery.
The bulls will be targeting long-term profits at around 61.80% and 50% Fib levels at 97.95 and 98.87. On the other hand, the bears will target pullback profits at around 76.40% Fib level at 96.58 or lower at 95.72.